Figure 5. Reduced magnitude of hippocampal tCREB expression with a corresponding reduction in long term potentiation (LTP) in misaligned mice.
(a) Representative immunoblots show the decrease in tCREB expression levels in misaligned vs. aligned mice, sampled at 6 hr intervals through the daily cycle (ZT). (b) pCREB levels are not significantly altered. (c) Misaligned feeding led to significant decreased levels of tCREB (p < 0.01). * indicates significant differences between groups at each time point (post hoc p < 0.05). Protein levels are expressed as arbitrary units (a.u.). Bar graphs represent the mean ± SEM of aligned (n = 4) and misaligned (n = 5) animals per time point. (d) tCREB immunoreactivity is decreased throughout the hippocampus in misaligned mice. Scale bar = 500 µm. (e) LTP was induced by high-frequency stimulation of the Schaffer collateral fibres, 2 x 100 Hz, 1 sec duration, 10 sec inter-train interval, delivered at time = 0. Daytime LTP responses recorded from the CA1 region were significantly decreased in misaligned mice (n = 6; p < 0.05) compared to aligned mice (n = 6). The inset shows fEPSPs recorded during baseline and 55–60 min post-HFS in aligned (left) and misaligned slice (right). (f) Paired-pulse facilitation ratios changed with intervals (p < 0.001), but were not significantly different between aligned and misaligned mice (p = 0.5) and no interactions between both factors were detected (p = 0.8). Line graphs represent the mean ± SEM (n = 6 per treatment).
DOI: http://dx.doi.org/10.7554/eLife.09460.011

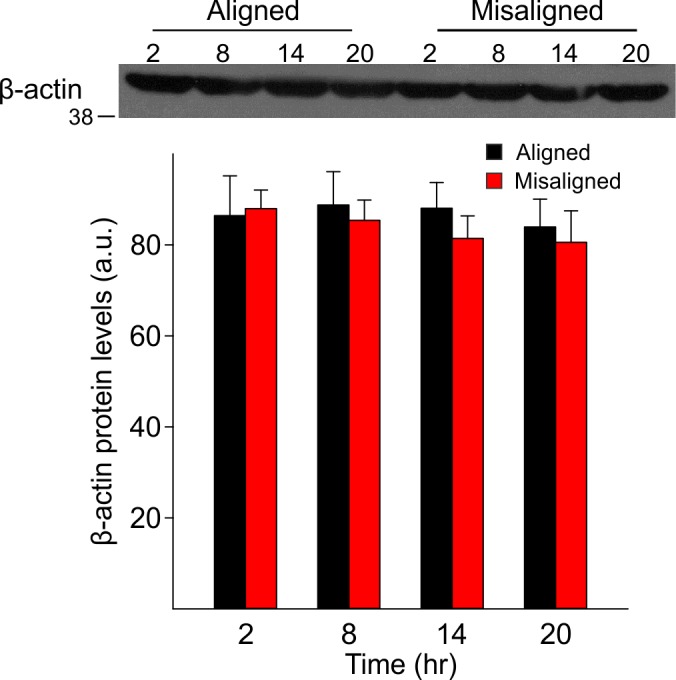
Figure 5—figure supplement 1. Expression levels of β-actin did not vary with time of day in both groups (p = 0.9), nor between aligned and misaligned mice (p = 0.9).
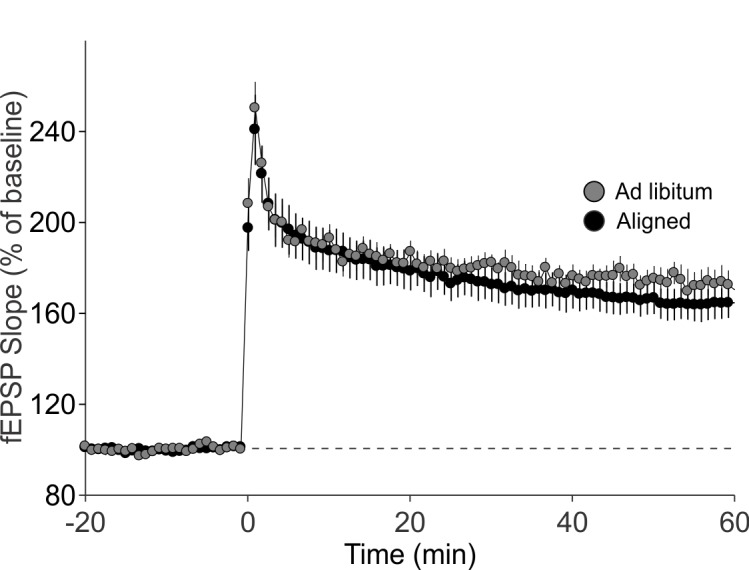
Figure 5—figure supplement 2. Aligned feeding does not significantly alter LTP magnitude compared to mice under ad libitum feeding (p = 0.4).