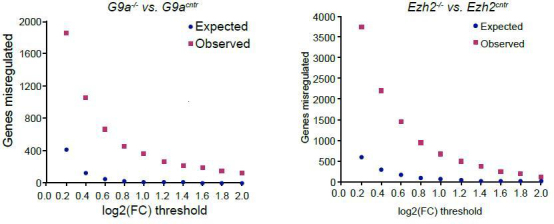
Author response image 3. Plot showing background (expected) and observed number of transcripts reaching specific fold change (FC) deregulation thresholds.

Expected values were estimated based on variability of gene expression between G9acntr or Ezh2cntrRNAseq samples. Observed dataset are genes reaching FC threshold in G9a-/- or Ezh2-/- RNAseq samples. The ration of observed vs expected reaches 0.01 value only at log2(FC)>1.4.
