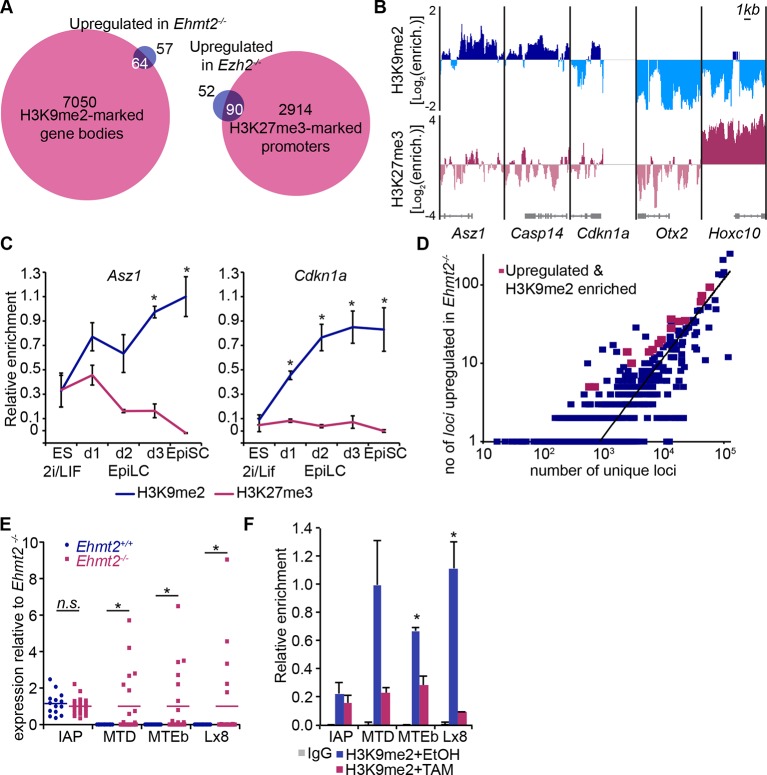
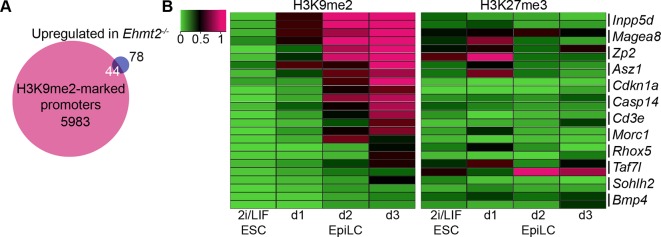
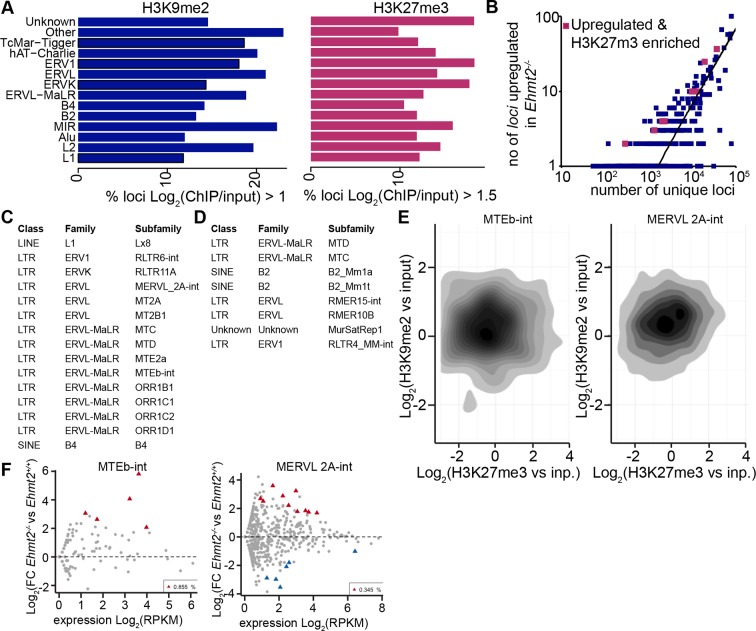
Figure 5. H3K9me2 and H3K27me3 are directly involved in repression of genes and transposable elements.
(A) Venn diagrams showing overlap between H3K27me3 enrichment at promoters (left panel) or H3K9me2 at gene bodies (right panel); genes upregulated in Ezh2−/− and Ehmt2−/− epiblasts are shown. The overlaps are statistically significant (p-value< 0.01 using Chi2 test). (B) Genome browser tracks showing H3K9me2 and H3K27me3 enrichment at genes that are: derepressed in Ehmt2−/− (Asz1, Casp14, Cdkn1a), active epiblast markers (Otx2), and PRC2 targets (Hoxc10). Data is shown as a sliding window (1kb and 300bp for H3K9me2 and H3K27me3, respectively) of enrichment over input: Log2(RPM ChIP/RPM Input). (C) lcChIP-qPCR validation for H3K9me2 and H3K27me3 at the promoter of Asz1 and gene body of Cdkn1a during EpiLC and EpiSC induction. Signal was scaled relative to average enrichment on negative (Gapdh: H3K9me2 and H3K27me3) and positive control regions (Pcsk5: H3K9me2, Hoxc10: H3K27me3). Data are represented as mean (± SEM) from three independent biological replicates (*Student’s t-test p-value<0.05 relative to 2i/LIF ESC sample). (D) Scatter plot showing correlation between the number of unique repeat loci in each subfamily with the number of loci upregulated in Ehmt2−/− E6.25 epiblast. Red points are subfamilies with significant H3K9me2 enrichment and increased proportion of upregulated loci. (E) Single cell RT-qPCR validation of repeat upregulation in individual E6.25 Ehmt2+/+ and Ehmt2−/−epiblast cells. Statistical significance was calculated using Wilcoxon rank sum test for IAP where the majority of WT and KO cells show detectable expression. For remaining repeats, a Chi2 test was used.(*p-value<0.05). (F) LcChIP-qPCR measuring H3K9me2 levels at selected repeat elements in Ehmt2F/− CreER+ve d2 EpiLCs treated with EtOH or TAM. Data are mean (± SD) from two independent biological replicates. (*Student’s t-test p-value<0.05 of EtOH compared with TAM treated sample). Also see Figure 5—figure supplement 1,2 and Figure 5—source data 1,2. H3K9me2: histone H3 lysine 9 dimethylation; H3K27me3: histone H3 lysine 27 trimethylation; EZH2: Enhancer of zeste homolog 2; ChIP: chromatin immunoprecipitation; EpiLCs: epiblast-like cells; EpiSCs: epiblast stem cells; SEM: standard error of the mean; TAM: tamoxifen; EtOH: ethanol; IAP: intracisternal A particle.
DOI: http://dx.doi.org/10.7554/eLife.09571.018


