. 2015 Nov 9;4:e09571. doi: 10.7554/eLife.09571

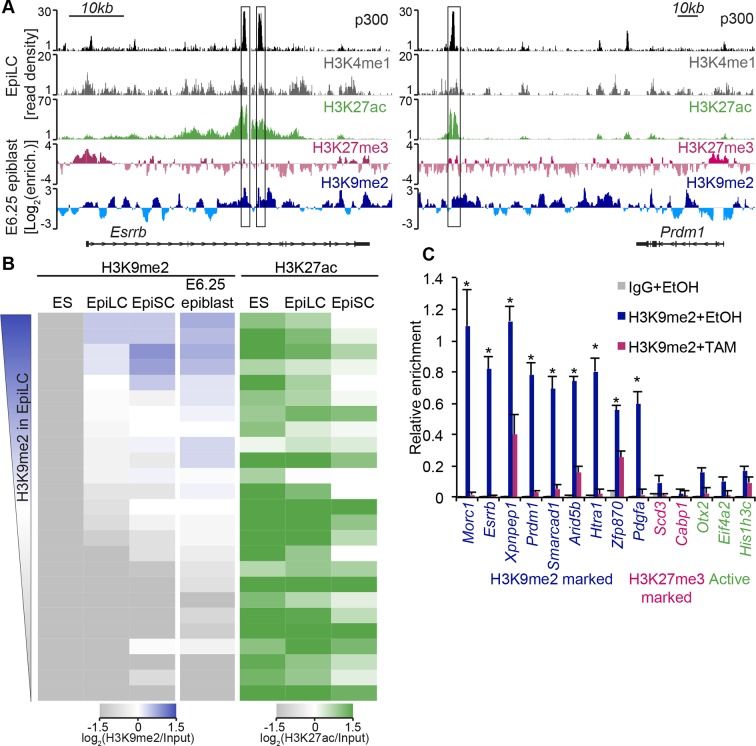
Figure 6. H3K9me2 marks enhancers undergoing inactivation during exit from naïve pluripotency.

(A) Genome browser tracks showing p300, H3K27ac, and H3K4me1 at inactive Esrrb and Prdm1 putative enhancers (black boxes) in day 2 EpiLCs (GSE56138) (Buecker et al., 2014). Bottom two tracks show H3K27me3 (red) and H3K9me2 (blue) enrichment in the E6.25 epiblast. Green and grey tracks show read density, while blue and red tracks show Log2 enrichment of ChIP sample over the input sample. (B) Heatmaps showing H3K9me2 and H3K27ac enrichment at enhancers active in ESCs grown in 2i/LIF. All ESC enhancers in 2i/LIF enriched for p300, H3K27ac and H3K4me1 were clustered using kohonen package based on H3K9me2 and H3K27ac. Individual classes were ranked based on H3K9me2 levels in EpiLCs. H3K27ac tracks were extracted from (GSE56138, GSE57409) (Buecker et al., 2014; Factor et al., 2014). (C) LcChIP-qPCR measuring H3K9me2 levels at putative enhancer elements in Ehmt2F/−CreER+ve d2 EpiLCs treated with EtOH or TAM. H3K9me2- (blue), H3K27me3- (red) marked, as well as active (green) regulatory elements are shown. Data are mean (± SD) from two independent biological replicates. (*Student’s t-test p-value<0.05 of EtOH compared with TAM treated sample). Also see Figure 6—figure supplement 1,2. H3K27ac: histone H3 lysine 27 acetylation; EpiLCs: epiblast-like cells; H3K27me3: histone H3 lysine 27 trimethylation; ChIP: chromatin immunoprecipitation; H3K9me2: histone H3 lysine 9 dimethylation; lcChIP-seq: low cell number chromatin immunoprecipitation with sequencing; TAM: tamoxifen; EtOH: ethanol; SD: standard deviation; ESCs: Embryonic stem cells.

DOI: http://dx.doi.org/10.7554/eLife.09571.023

Figure 6.

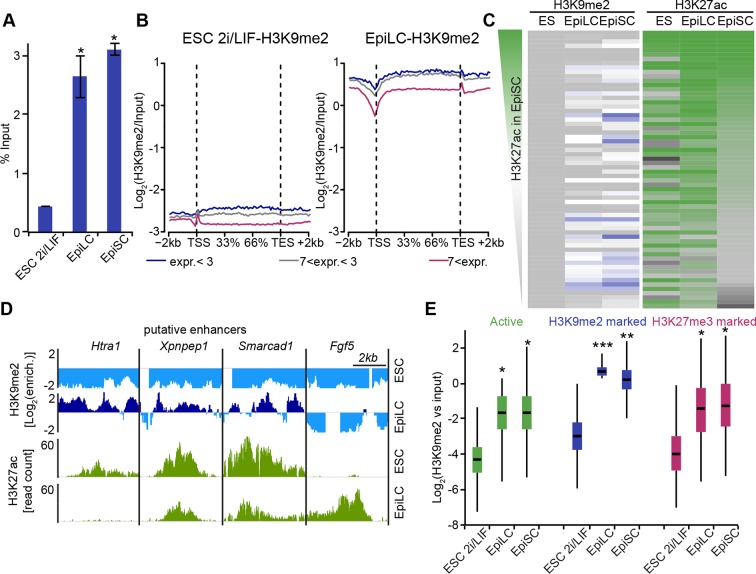
Figure 6—figure supplement 1. Genome-wide accumulation of H3K9me2 extends to multiple enhancer elements.

Figure 6—figure supplement 1.

(A) Bar plot showing H3K9me2 levels in ESC, d2 EpiLC and EpiSC measured by quantifying total DNA in anti-H3K9me2 ChIP relative to the input sample. Shown is mean (± SD) from at least two independent biological replicates. (B) Enrichment of H3K9me2 in 2i/LIF ESCs and EpiLCs visualized with a metagene analysis. Genes were classified based expression level. Data is based on nChIP-seq scaled to absolute H3K9me2 levels (A). (C) Heatmap showing H3K9me2 and H3K27ac enrichment at all enhancers active in ESC, EpiLC and EpiSC. Individual enhancer elements were clustered and then sorted based on H3K27ac enrichment in EpiSC. (D) Genome browser tracks showing H3K9me2 (blue) and H3K27ac (green) putative enhancers in 2i/LIF ESC and d2 EpiLCs. H3K27ac tracks are from published datasets (Buecker et al., 2014). Green tracks show read density, while blue tracks show Log2 enrichment of ChIP over the input sample. (E) Box plots showing H3K9me2 levels at enhancers in 2i/LIF ESC, EpiLCs and EpiSCs. Significance was calculated using unpaired Wilcoxon rank sum test with continuity correction. Effect size: *r≤0.10; **0.10<r≤0.15; ***r>0.15.
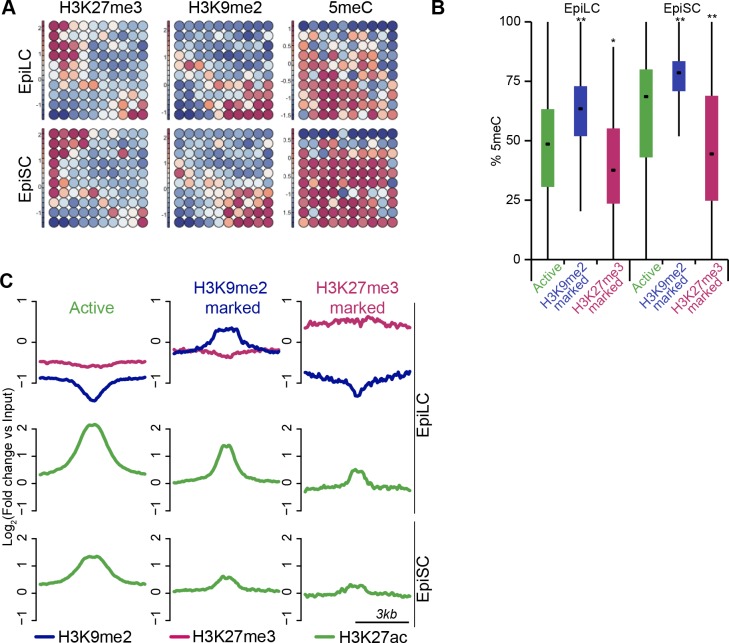
Figure 6—figure supplement 2. H3K9me2 marks a distinct set of enhancers.

Figure 6—figure supplement 2.

(A) Unbiased dynamics of ESC enhancers upon exit from naïve pluripotency. Classification was performed using self-organizing maps. Some enhancers become inactivated via acquisition of H3K27me3 or H3K9me2. Each of these modes is associated with distinct DNA methylation levels. (B) Box plots showing DNA methylation levels at enhancers in EpiLCs and EpiSCs. Significance was calculated using unpaired Wilcoxon rank sum test with continuity correction. Effect size: *r≤0.10; **0.10<r≤0.15; ***r>0.15. (C) Chromatin profiles over enhancers in EpiLC and EpiSC. Active ESC enhancers (p300, H3K4me1 and H3K27ac enriched) were classified using k-means clustering based on H3K9me2 and H3K27me3 enrichment in EpiLCs.