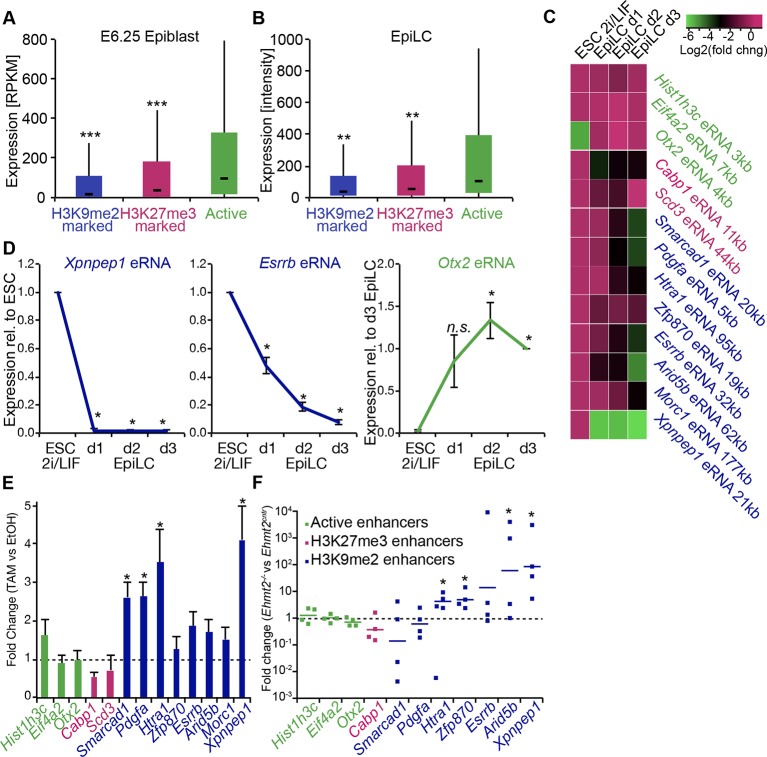
Figure 8. G9a promotes transcriptional inactivation of enhancers.
(A,B) Box plots showing transcript levels of genes in epiblast (A) and EpiLCs (B), which lie in proximity of H3K9me2- or H3K27me3-marked enhancers. All comparisons are statistically significant (p<0.05). The effect size relative to active set is shown in the graphs: *r≤0.10; **0.10<r≤0.15; ***r>0.15 calculated using Wilcoxon rank sum test. For analysis of EpiLCs, a published microarray experiment was used (GSE30056) (Hayashi et al., 2011). (C,D) RT-qPCR for eRNAs at selected H3K9me2-marked (blue) and control (red: H3K27me3 enriched, green: active) enhancers shown as line plots (D) and summarized in a heatmap (C). Data are represented as mean ( ± SEM) from three independent biological replicates. Samples are normalised to ESC 2i/LIF sample with the exception of Otx2, which is normalised to d3 EpiLCs. (*Student’s t-test p-value<0.05) (E) FC of eRNA expression in Ehmt2F/− CreER+ved2 EpiLCs treated with TAM relative to EtOH control. Transcripts are originating from H3K9me2- (blue), H3K27me3-marked (red) or active (green) loci. Data are presented as mean (± SEM) from three independent biological replicates. (*Student’s t-test p-value <0.05) (F) FC of eRNA expression in individual Ehmt2−/− E6.25 epiblasts normalised to Ehmt2+/+ littermates. Lines show geometric means. (*p<0.05 Wilcoxon rank sum test). Also see Figure 8—figure supplement 1. EpiLCs: epiblast-like cells; H3K9me2: histone H3 lysine 9 dimethylation; H3K27me3: histone H3 lysine 27 trimethylation; RT-qPCR: real-time quantitative polymerase chain reaction; eRNA: enhancer RNA; ESCs: Embryonic stem cells; TAM: tamoxifen; EtOH: ethanol.


