Figure 4.
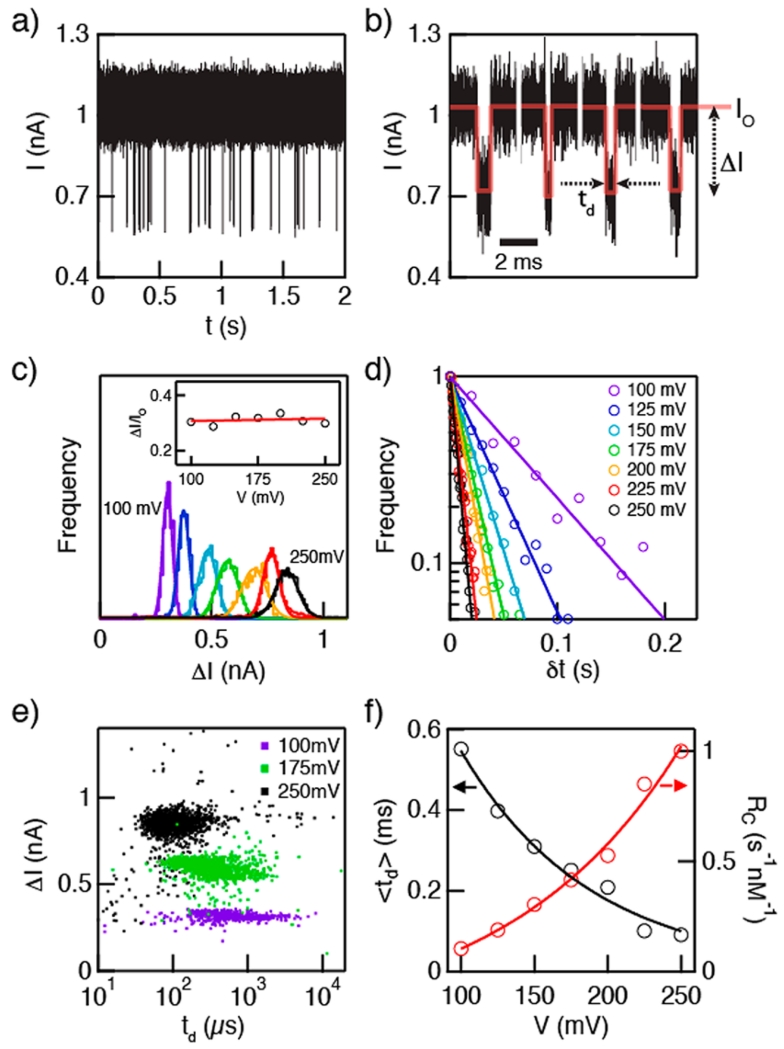
Transport of 150 nM 100 bp double-stranded DNA (dsDNA) through a d = 3.6 nm HfO2 nanopore. (a) Continuous two-second current trace at V = 100 mV. (b) Representative concatenated events following analysis using OpenNanopore53 software. Each event is defined by its mean current amplitude (ΔI) and dwell time (td). Red line represents square wave fit to each event. (c) Histograms of ΔI at different voltages in the range V = 100–250 mV, showing a regular increase in ΔI with increasing voltage. Inset shows the fractional blockage, ΔI/Io, which is found to be independent of voltage. (d) Distributions of event interarrival times at different voltages (δt). Lines are fits to the distributions, from which the capture rates Rc are extracted. (e) Scatter plots of ΔI vs td for selected voltages. The decrease in spread of td values with increasing voltages exemplifies the transition from diffusion-dominated to drift-dominated transport. (f) Peak td (left axis) and Rc (right axis) values as a function of voltage (see Supporting Information), showing exponential dependence for both parameters (see text).

