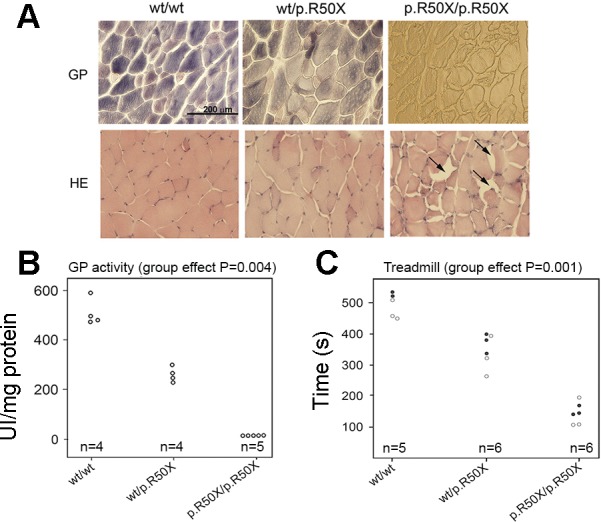
Fig. 3.

McArdle mouse phenotype. A: representative images of the gastrocnemius muscle indicate gross differences in glycogen. GP, glycogen phosphorylase activity staining; H&E, hematoxylin and eosin staining; wt, wild type. Arrows indicate glycogen accumulation in the homozygote (scale bar 200 μm, all images). B: glycogen phosphorylase activity is reduced with each copy of the p.R50X allele. C: treadmill performance is reduced in a similar dose-dependent manner with the p.R50X allele. [Figure adapted from Nogales-Gadea et al. 2012 (64) used with permission from Oxford University Press.]
