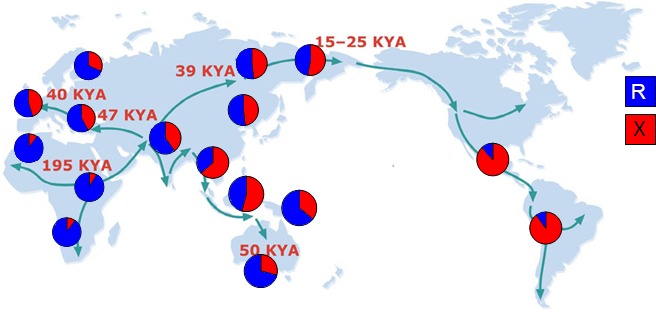
Fig. 4.

Global frequencies of R577X ACTN3 alleles in native populations. Pie charts indicate the percentage of the ACTN3 577R (blue) and the null 577X (red) alleles in native populations from 16 different regions. Arrows depict human migration out of Africa ∼50 thousand years ago (KYA) [data from MacArthur et al. 2007 (52)].
