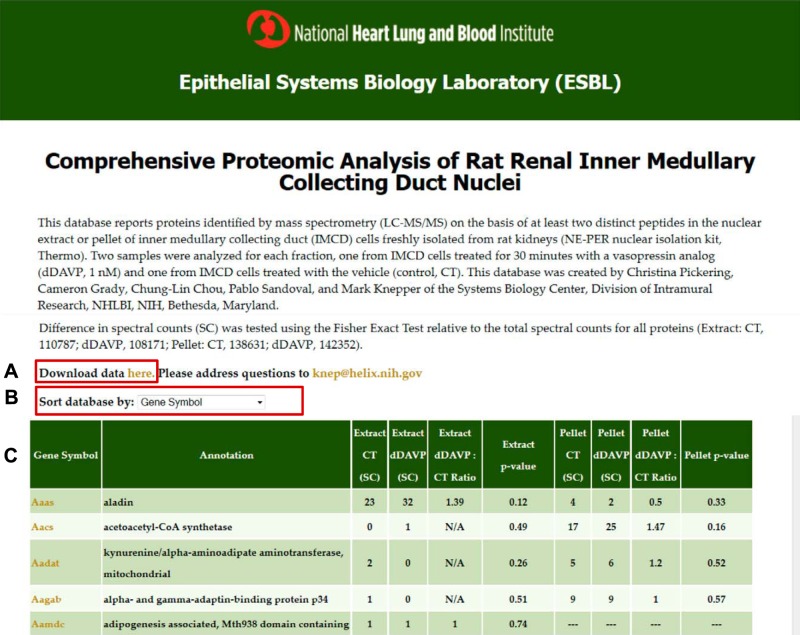
Fig. 1.
Screenshot of webpage. The user may download the full dataset (A) or sort by different attributes (B). For each protein, the webpage gives several elements of information (C): official gene symbol, annotation (protein name), spectral counts in nuclear extract (NE) fraction for control (CT) and dDAVP conditions, ratio of spectral counts (dDAVP:CT) for NE fraction, P value for NE (Fisher exact test), spectral counts in nuclear pellet (NP) fraction CT and dDAVP conditions, ratio of spectral counts (dDAVP:CT) for NP fraction, P value for NP (Fisher exact test). (For the NE and NP fractions, the P values represent the probability that a difference in spectral counts between control and dDAVP samples could have been obtained by random selection from all spectra found in the respective fraction.) Virtual Western blots may be viewed by clicking on the Gene Symbols for individual proteins. This webpage may be accessed at https://helixweb.nih.gov/ESBL/Database/IMCD_Nucleus/.

