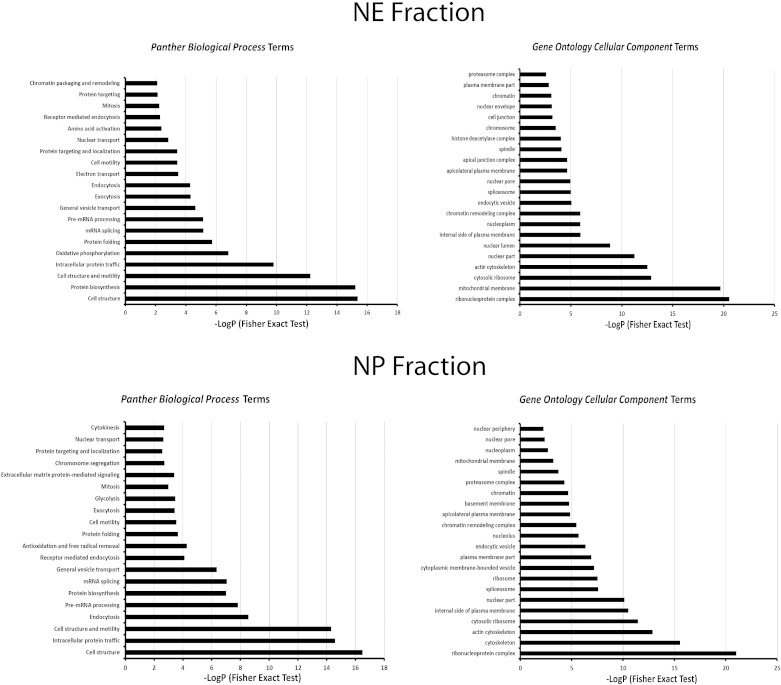
Fig. 3.
Enriched Panther biological process terms and Gene Ontology cellular component terms for proteins in the NE fraction (top) and NP fraction (bottom). The background gene list for this analysis was the list of all transcripts detected above threshold in rat inner medullary collecting duct (IMCD) using Affymetrix expression arrays (see text). Analysis was done using the DAVID online tool (Database for Annotation, Visualization and Integrated Discovery version 6.7; NIAID, NIH, Bethesda, MD). The Fisher exact tests compared the fraction of proteins in the NE or NP list associated with a given term to the fraction of proteins coded by the full IMCD transcriptome with that term. The P values report the probability that the fraction in the NE or NP list would be seen by random selection from the transcriptome list.

