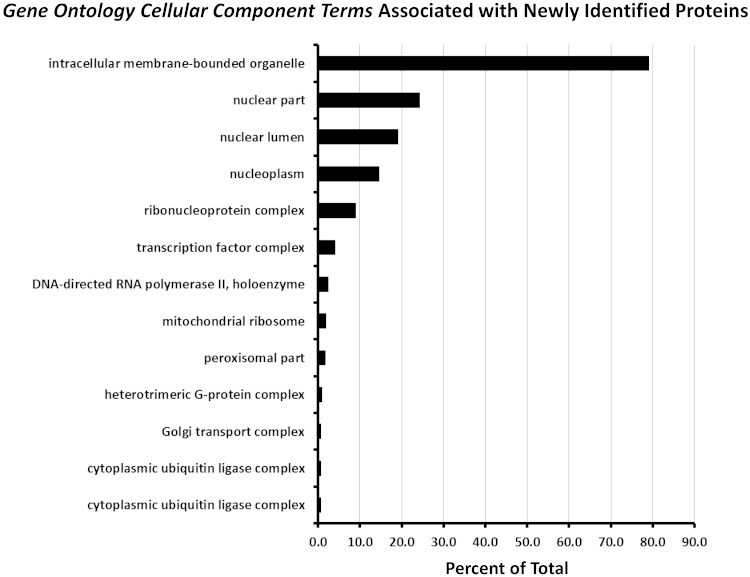
Fig. 4.
Classification of the newly identified proteins in this study based on enriched Gene Ontology cellular component terms. Analysis was done using the online tool DAVID. The graph shows all Gene Ontology cellular component terms with P value < 0.01 (Fisher exact test comparing the fraction of proteins in the newly identified list associated with a given term to the fraction of proteins coded by the full IMCD transcriptome with that term). Horizontal axis shows the percent of the total number of newly identified proteins with a given term.

