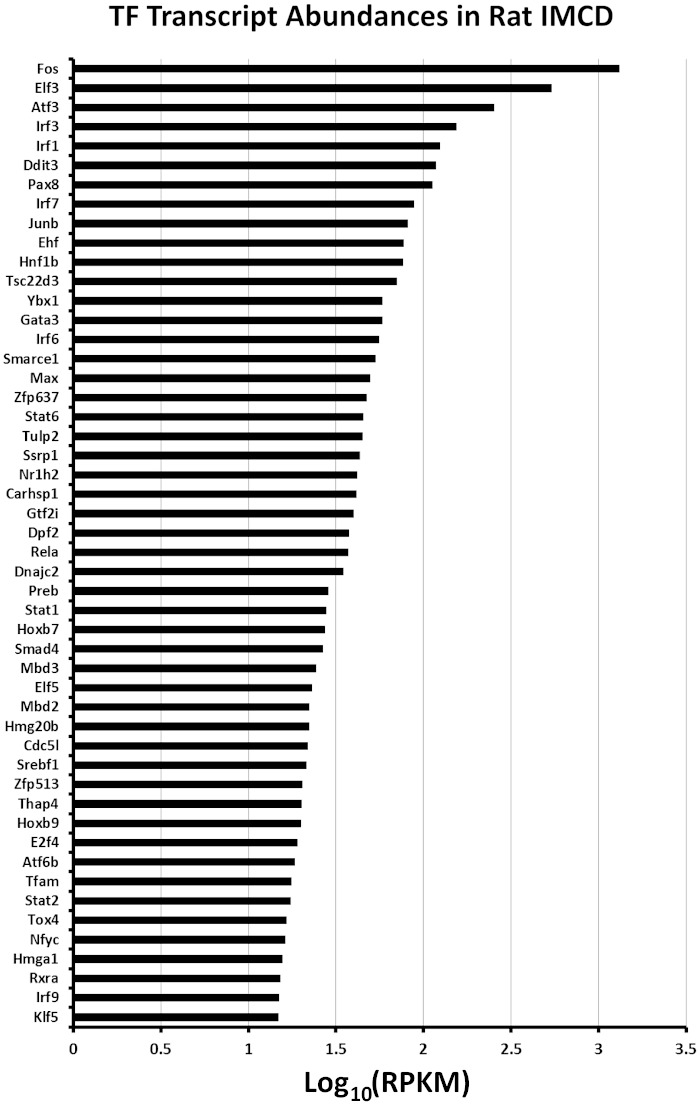
Fig. 6.
Ranking of the most abundant transcription factors (TF) identified in this study from the point of view of transcript abundance. Transcript abundance values in RPKM (reads per kilobase of transcript per million mapped reads) for isolated rat IMCD segments are taken from https://helixweb.nih.gov/ESBL/Database/NephronRNAseq/All_transcripts.html. TFs are identified by their official gene symbols (vertical axis).

