
Fig. 6.
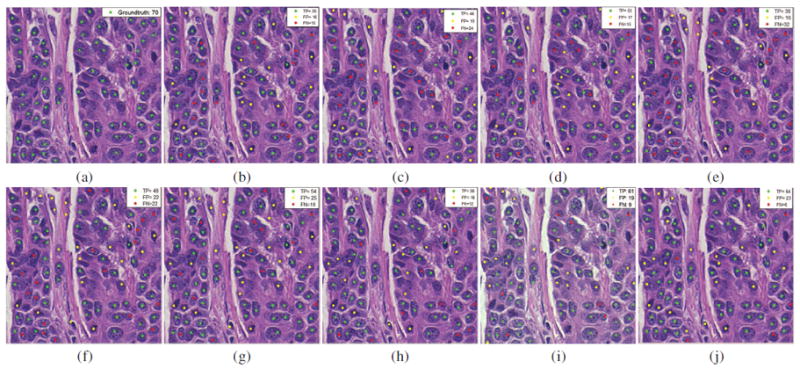
The nuclear detection results of EM (b), BRT(c), CD(d), SMC (e), AE+SMC (f), SAE+SMC (g), STAE+SMC (h), CNN+SMC (i), and SSAE+SMC (j) models for a 400 × 400 patch selected from the black square region in Figure 5 (a). The ground truth of manually detected nuclei are shown as green dots in (a). (b), (c), (d), (e), (f), (g), (h), and (i). The green, yellow, and red dots in these images represent the TP, FP, and FN with respective to ground truth, respectively.