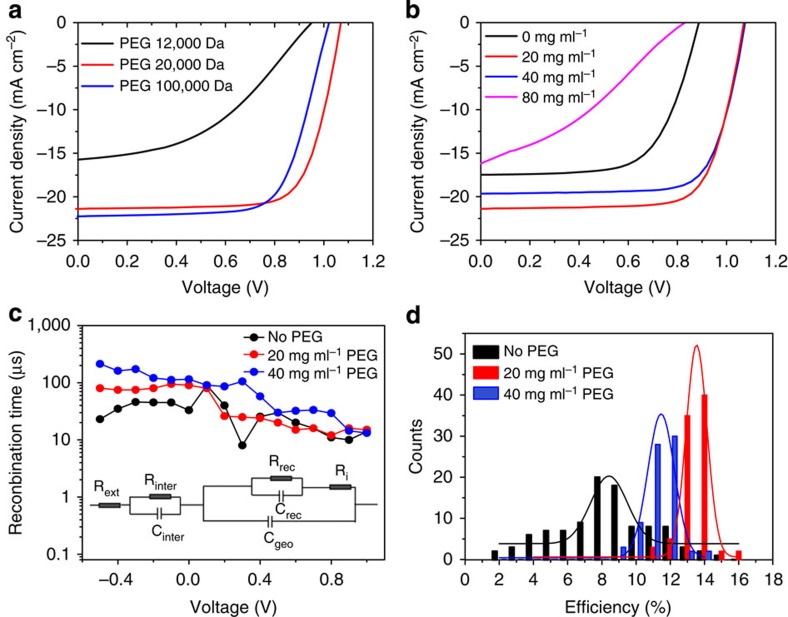
Figure 4. Photovoltaic characterization of polymer-scaffold perovskite solar cells.
(a) J–V curves of the reverse scan based on precursor solution with different PEG molecular weight (concentration: 20 mg ml−1) measured from 1.5 to −0.2 V under 500 mV s−1. (b) J–V curves of the reverse scan based on precursor solution with different PEG concentration (molecular weight: 20,000 Da) measured from 1.5 to −0.2 V under 500 mV s−1. (c) Recombination time constant Rrec.Crec (Rrec, recombination resistance, Crec, capacitance) under different applied voltage can be extracted by fitting the Nyquist plot using the inset circuit. (d) PCE distribution of perovskite solar cells with (20 or 40 mg ml−1) and without PEG scaffold. PCE values are extracted from reverse scan curve measured from 1.5 to −0.2 V under 500 mV s−1. The active area for testing is 9 mm2.

