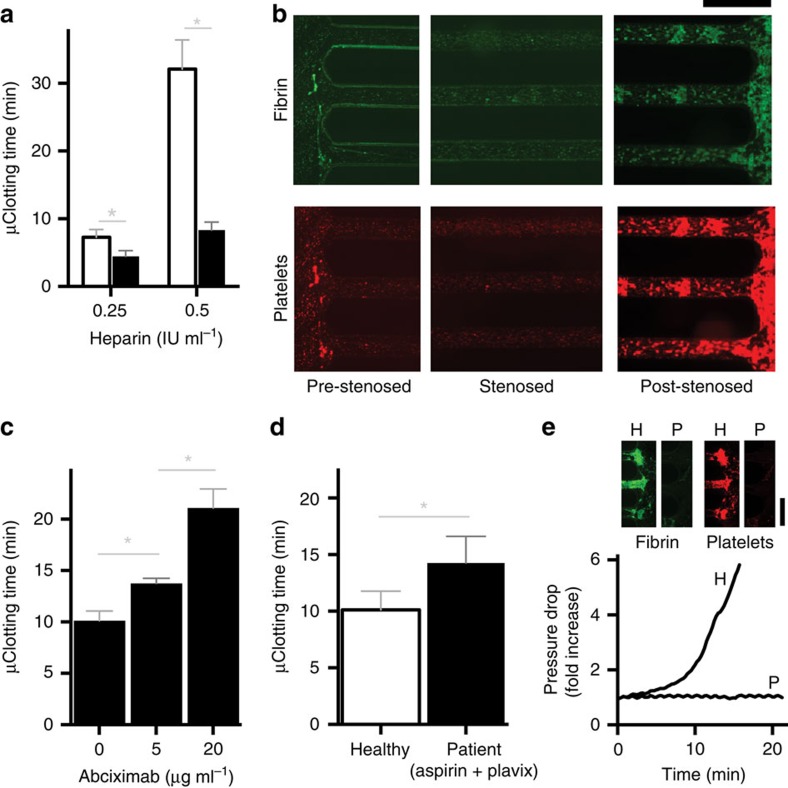
Figure 3. Rapid platelet function analysis in vitro.
(a) Microfluidic clotting time (μCT) measured when the blood is perfused (shear rate gradient=1,225 s−1 mm−1) through a haemostasis monitoring microdevice coated with collagen (black bars, 100 μg ml−1) compared with bare surface (white bars), shown at two different heparin concentrations (0.25 IU ml−1 and 0.5 IU ml−1, respectively; *P<0.05, multiple t-tests, s.e.m.; n=3 donors, 2 replicates per experiment). (b) Representative fluorescent micrographs of pre-stenosed, stenosed and post-stenosed regions of the same collagen-coated microfluidic device (shear gradient, 4,375 s−1 mm−1), showing fibrin (top, green) and adhered platelets (bottom, red) after it occluded due to perfusion of recalcified citrated blood for 20 min (scale bar, 500 μm). (c) μCT measured for citrated blood containing different doses of an anti-platelet drug, abciximab (Reopro), when perfused through the device after recalcification (shear gradient, 4,375 s−1 mm−1; *P<0.05, one-way ANOVA, s.e.m.; n=3 donors, 2 replicates per experiment). (d) μCT measured from perfused recalcified citrated blood samples (shear gradient, 4,375 s−1 mm−1) of healthy donors (white bars) versus patients who take Aspirin and Plavix (clopidogrel) regularly (black bars) (*P<0.05, unpaired t-test, s.e.m.; n=5 healthy donors and 9 patients, 2 replicates per experiment). (e) A representative trace of pressure rise measured in the device, and fluorescent micrograph showing fibrin (top left,green) and platelet (top right,red) deposition at the post-stenosed region of the device, when blood from a healthy individual (H) was flowed through the device compared with blood from an HPS patient (P; shear gradient: 4,375 s−1 mm−1; scale bar: 500 μm). HPS, Hermansky–Pudlak Syndrome.

