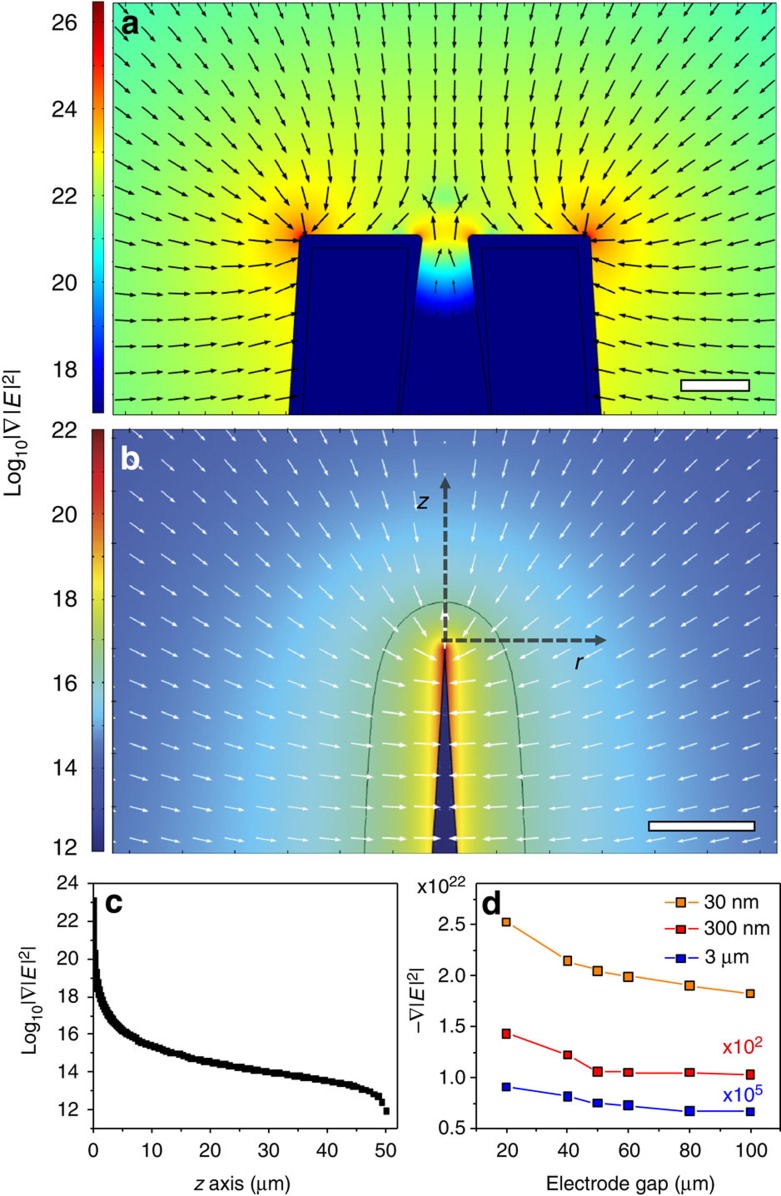
Figure 2. Finite-element method modelling of DEP with the nanopipette.
Two-dimensional-axisymmetric electrostatic modelling of a 50 μm electrode gap between the nanopipette tip and a conductive flat electrode was simulated with a 10 V DC signal applied. Plots of the magnitude of the field intensity gradient, which is proportional to the force on a particle, are shown for regions (a) near the end of the pipette (scale bar, 25 nm) and (b) the DEP trapping volume and surrounding area (scale bar, 10 μm). The logarithmically scaled arrows show the direction of the force. The black contour line in b is along |∇|E|2|=1016.4 V2 m−3, which corresponds approximately to the threshold field intensity gradient for trapping 10 kbp DNA against Brownian motion. (c) The magnitude of the field intensity gradient along the z axis (black dashed arrow) in b. (d) The strength of |∇|E|2| was also tracked at different distances from the tip of the nanopipette along the z axis for electrode gaps ranging from 20 to 100 μm with a 10 V DC applied signal. The field intensity gradient strength decreases logarithmically with increasing gap size.

