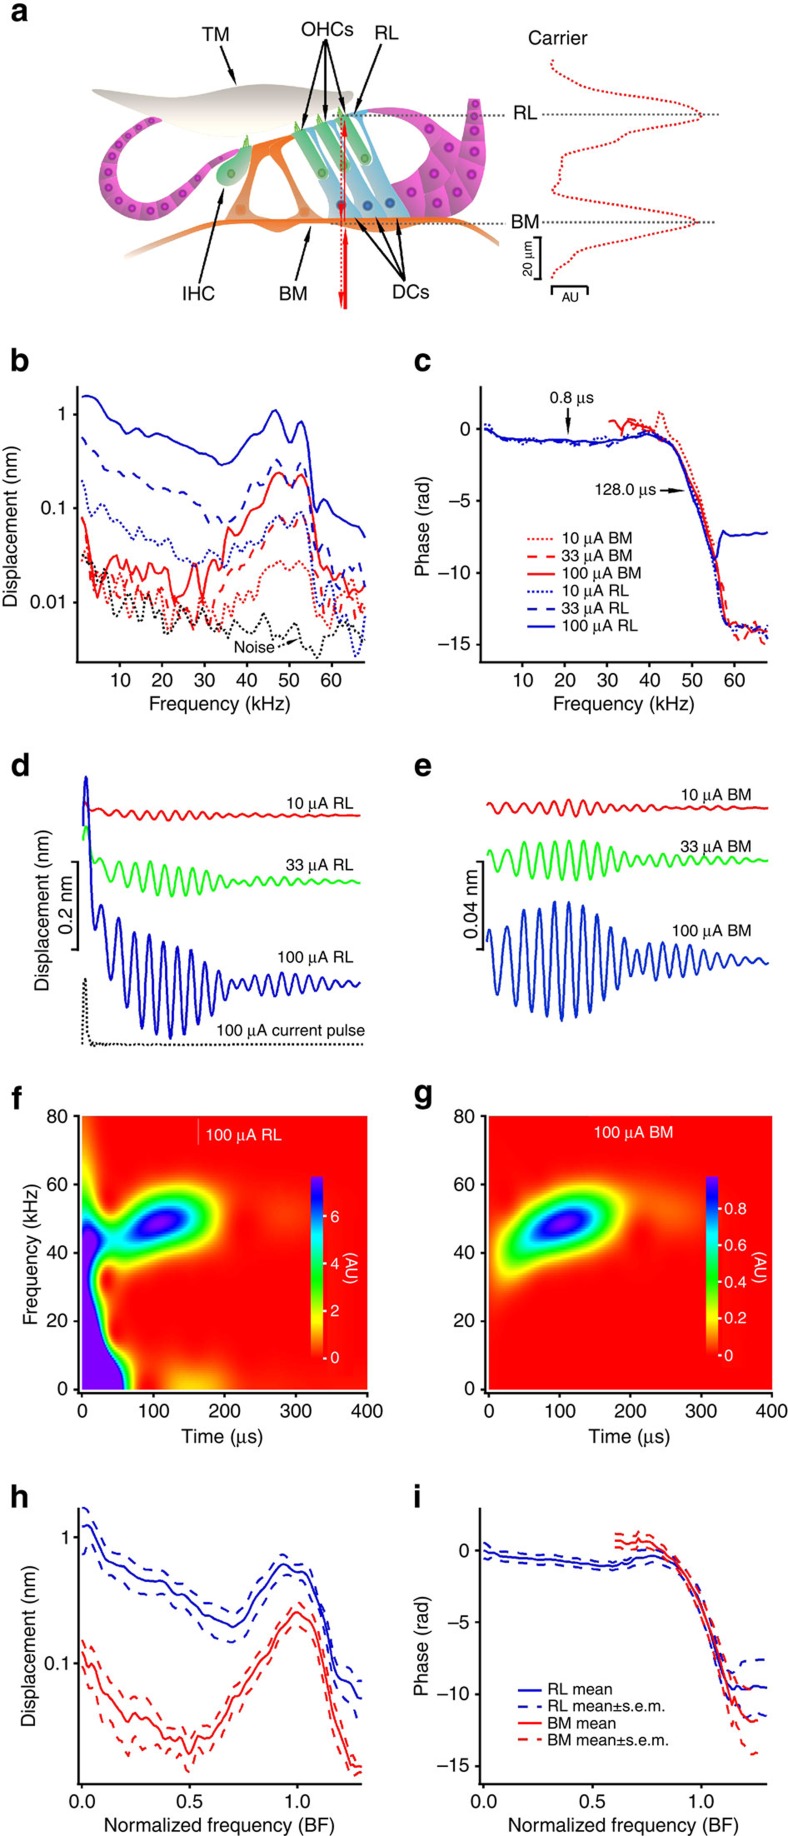
Figure 1. Measurement diagram and electrically evoked reticular lamina and basilar membrane vibrations in wild-type mice.
(a) Diagram of the organ of Corti and measurement of the reticular lamina (RL) and basilar membrane (BM) vibrations. The BM and RL locations in the transverse direction were indicated by the peaks of the carrier signal (red dotted line on the right). IHC, inner hair cell. OHCs, outer hair cells. TM, tectorial membrane. DCs, Deiters' cells. (b) Magnitudes of RL (blue) and BM (red) responses as a function of frequency. The noise floor (black dotted line) was below 0.01 nm at frequencies above 15 kHz. (c) RL and BM phase. (d) Time responses of the RL (blue, green, and red curves) and the electrical stimulus (black dotted line). (e) Time responses of the BM. (f,g) Spectrograms of RL and BM responses to 100-μA current. (h,i) Grouped magnitudes and phase of RL (blue) and BM (red) responses to 100-μA currents (n=5; mean±s.e.m.). Frequency axes were normalized to the best frequency (BF) of the basilar membrane for calculating means and s.e.m.

