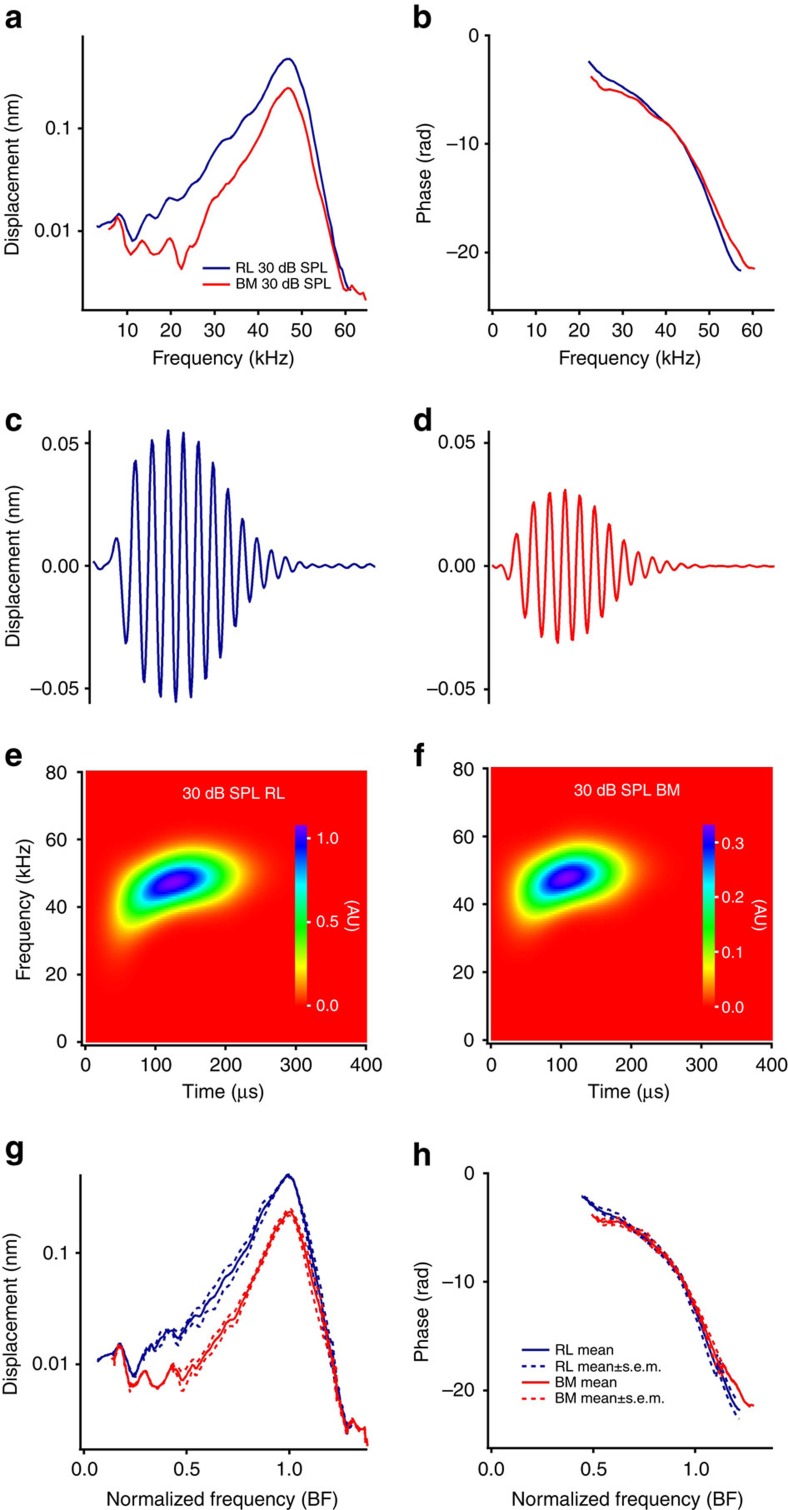
Figure 2. Acoustically evoked reticular lamina and basilar membrane vibrations in wild-type mice.
(a) Magnitudes of reticular lamina (RL) (blue) and basilar membrane (BM) (red) responses to 30-dB SPL tones as a function of frequency. (b) RL and BM phase responses. (c) The time waveform of the RL response showed only delayed periodic oscillations without the initial peak. (d) Time waveform of the BM is similar to the RL response except for a small magnitude. (e,f) Spectrograms of the RL and BM only show the delayed tuned component. (g,h) Grouped magnitudes and phase of the RL (blue) and BM (red). Data are presented as mean±s.e.m. (n=7).

