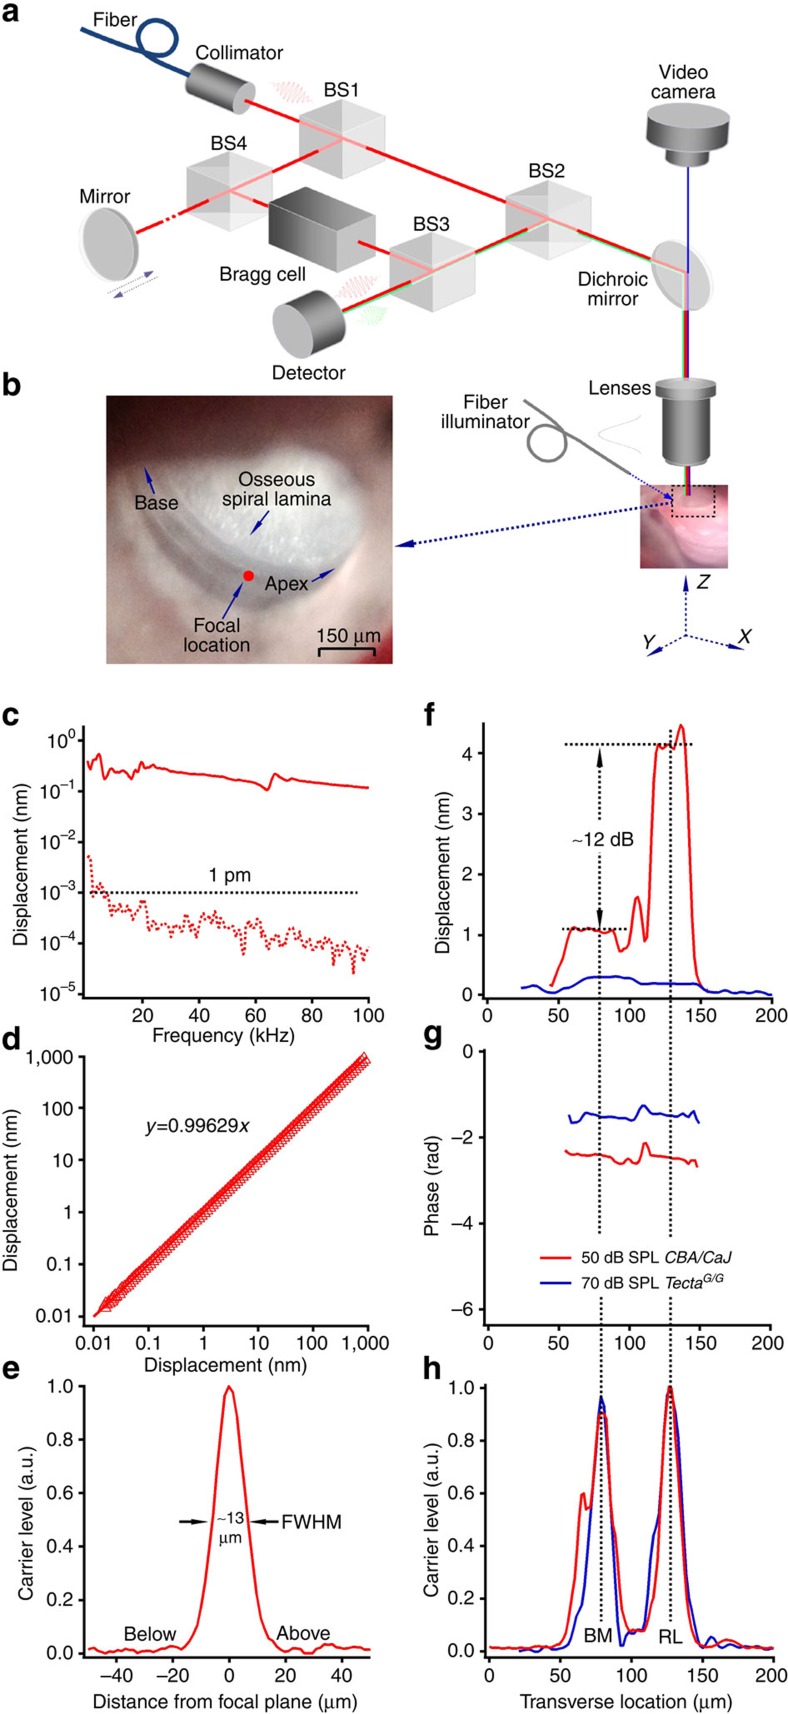
Figure 6. The custom-built heterodyne low-coherence interferometer and its performance.
(a) Diagram of the interferometer. BS1-4, polarization maintaining beam splitters. (b) The intravital image of the cochlear partition taken through the intact round window membrane using the microscope with white light transillumination. The object light beam was focused on the outer hair cell region, which was confirmed visually by changing the focal plane. (c) The noise floor of the measurement is <1 pm at frequency above 8 kHz (red dotted line), and the frequency response is up to 100 kHz (red solid line). (d) The displacement measured using the low-coherence interferometer increased linearly with vibration magnitude from 0.01 to 1,000 nm. (e) The peak of the backscattered light level from a glass surface in air had full-width at half maximum (FWHM) ∼13 μm, equivalent to ∼10 μm in water, which was determined by the coherence length of the light and numerical aperture of the objective lens. (f,g) Magnitude and phase responses to acoustical stimuli in a wild-type (red) and a TectaG/G (blue) mouse as a function of the transverse location. (h) The carrier signal peaked at the BM and RL locations.

