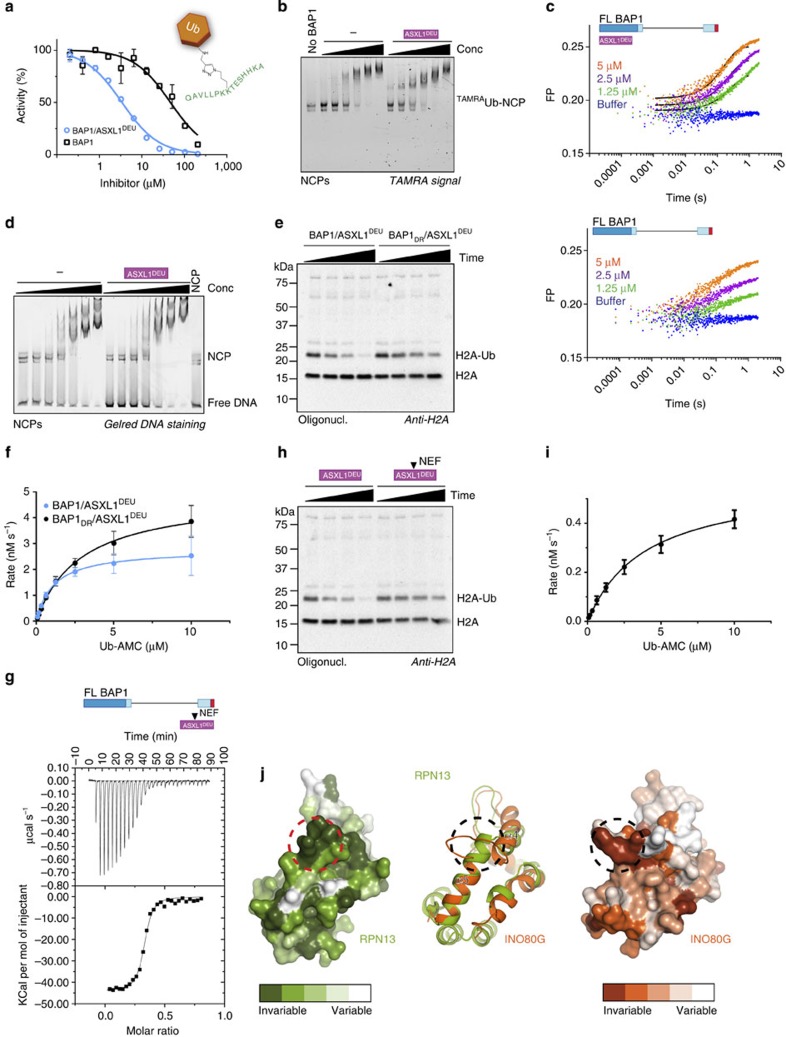
Figure 3. ASXL1DEU activates BAP1 by increasing its affinity for ubiquitin.
(a) Ub-AMC hydrolysis assay of BAP1 and BAP1/ASXL1DEU in the presence of an H2A peptide that is conjugated to ubiquitin at K119 in a non-hydrolyzable fashion. This conjugate mimics substrates and therefore functions as an inhibitor for Ub-AMC hydrolysis. BAP1 is inhibited more readily by the non-hydrolyzable ubiquitin conjugate in the presence of ASXL1DEU. Inset shows the schematic of the non-hydrolyzable H2A ubiquitin conjugate. Error bars, s.d. (n=2 independent experiments). (b) Native gel shift assay of NCPs mono-ubiquitinated with TAMRAubiquitin and BAP1 or the BAP1/ASXL1DEU complex. In the presence of ASXL1DEU, BAP1 has a higher affinity for mono-ubiquitinated NCPs than BAP1 alone (twofold dilutions starting from 15 μM). Band visualized using the TAMRA signal (c) Using stopped-flow fluorescence polarization binding assays we confirmed that the BAP1/ASXL1DEU complex (top) binds better to K119 mono-ubiquitinated NCPs than BAP1 alone (bottom). (d) BAP1 and BAP1/ASXL1DEU bind unmodified NCPs with similar affinities in band-shift assays (twofold dilutions starting from 15 μM). Bands visualized using DNA staining by GelRed. (e) Anti-H2A western blot showing that the BAP1 ULD anchor mutant (D663A/R667A, DR) complex is less active in deubiquitinating oligonucleosomal H2A than the WT complex (time points: 0, 1, 5, 25 min) (f) In Ub-AMC hydrolysis assays, BAP1DR/ASXL1DEU complex has a threefold weaker KM than the WT complex. Error bars, s.d. (n=3 independent experiments). (g) ASXL1NEFDEU (N310A/E311K/F312A, NEF) binds BAP1 with similar affinity as WT ASXL1DEU in ITC. (h and i) ASXL1NEFDEU cannot activate BAP1 to the same extent as WT ASXL1DEU using K119 mono-ubiquitinated oligonucleosomal H2A as visualized by western blot (time points: 0, 1, 5, 25 min) or Ub-AMC as a substrate. Error bars, s.d. (n=3 independent experiments). (j) Surface representation of DEUBAD domains of RPN13 (left) and INO80G (right) indicate high conservation of a region (dotted circle) between helix 4 and 5 (middle: RPN13 green, INO80G orange). Surface conservation was calculated using ConSurf52.

