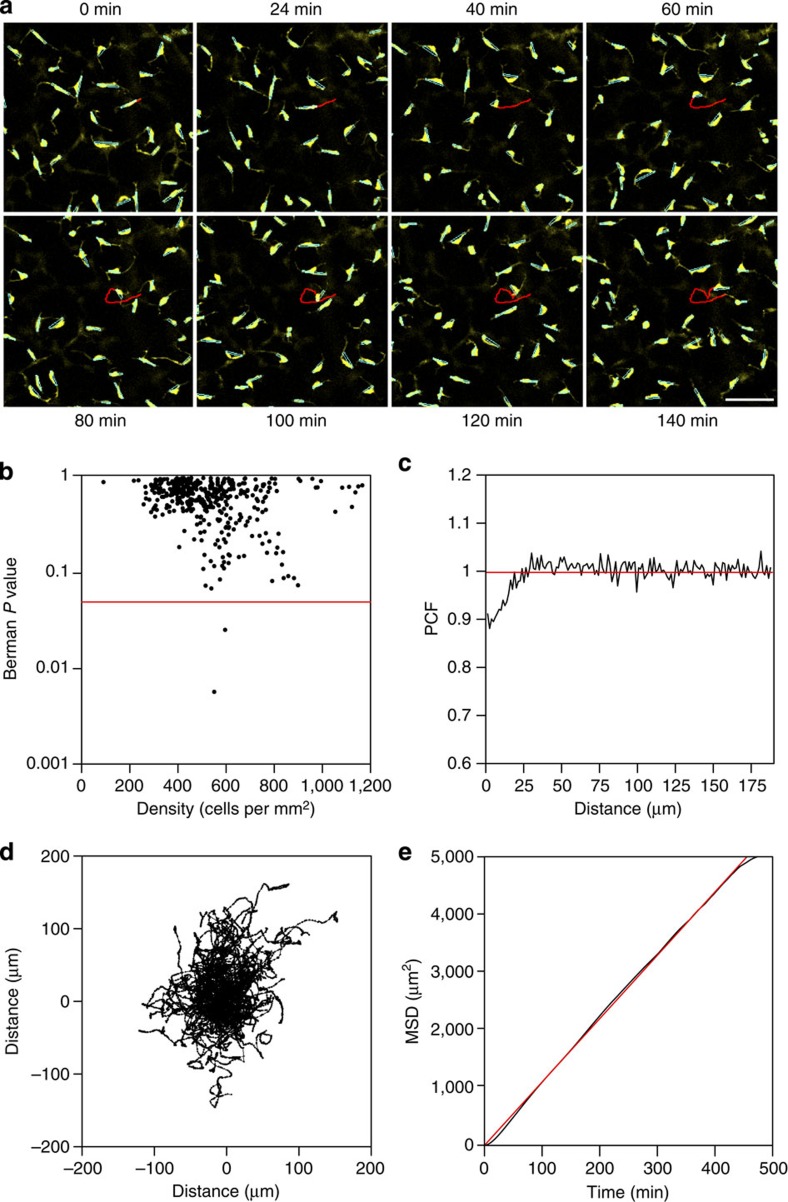
Figure 1. Melanoblast migration is undirected and not driven by repulsion.
(a) A time-lapse sequence of melanoblasts migrating in ex vivo culture of E14.5 skin. The Feret's diameter of each cell body is indicated in cyan. The path of a single migrating cell is indicated in red. Melanoblasts migrate along their Feret's diameter—the longest distance between any two points along a given boundary. The distribution of the Feret's angles in the time-lapse sequences invariably conformed to a uniform distribution (Kolmogorov–Smirnov Test P>0.05 in all cases, n=414 independent tests) implying that melanoblast migration is undirected. (b) An analysis of the spacing of melanoblasts in the time-lapse sequences at E14.5. A range of cell densities was observed at the start of each time-lapse (t=0) between 242 and 780 cells per mm2 (mean±95% CI=448.52±57.46 cells per mm2, n=20). Independent spatial patterns were generated by sampling each time-lapse at 40-min intervals. Each spatial pattern (n=414 patterns) representing the x, y position of the centre of mass of each cell was tested for complete spatial randomness (CSR) using a Berman's test for a point process model. In the majority of examples the pattern conforms to CSR (n=412 out of 414 independent tests). The 0.05 significance line is indicated in red, the Berman's P value is plotted against the cell density at t=0. (c) Average PCF for melanoblast spatial organization at E14.5 for data in b. The red line indicates complete spatial randomness at all distances. Melanoblast spacing conforms to CSR at distances over ∼28 μm. (d) All tracks of a time-lapse sequence plotted from a zero origin showing a homogeneous population spread. (e) Plot of the MSD of the tracks panel 1d against time. A straight line through the origin (red) can be fitted to the data (black) indicating that the population is diffusing. The slope of the line is used to derive the diffusion coefficient (D). PCF, pairwise correlation function. Scale bar in a, 50 μm.

