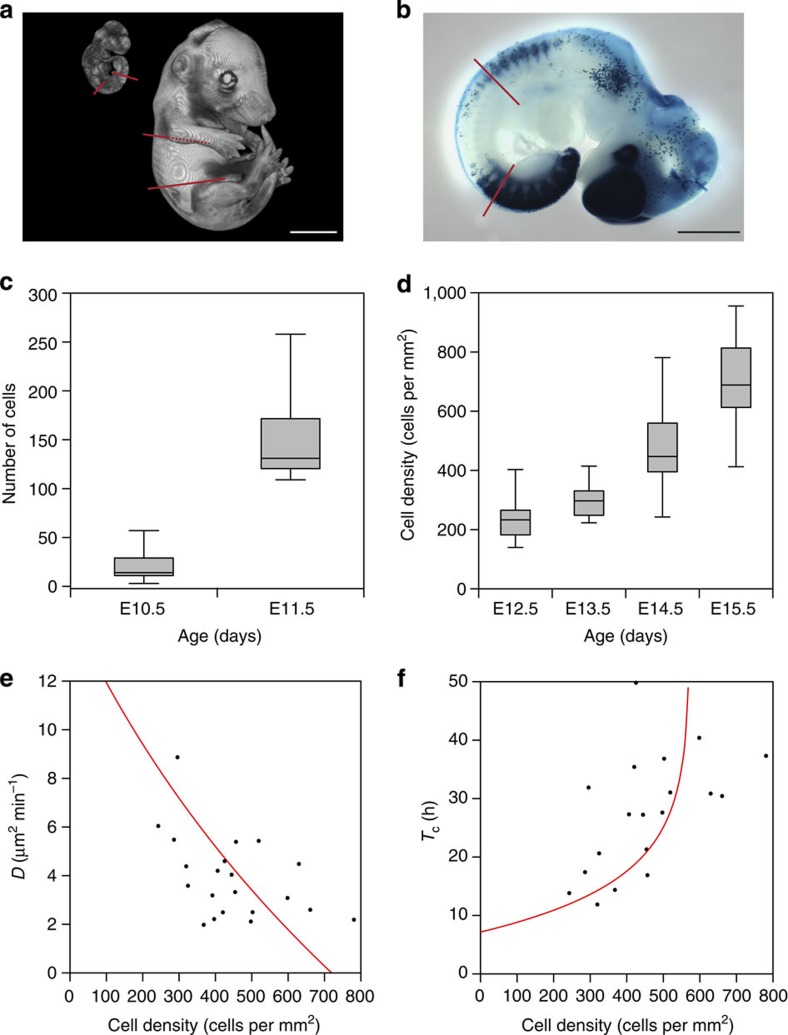
Figure 2. Key biological parameters.
(a) For our experimental measurements we only considered the trunk region between the limb buds indicated by the coloured lines on the optical projection tomography (OPT) models at E10.5 (left) and E15.5 (right). This was defined as the axial width. (b) We used X-Gal-stained Dct::lacZ embryos to analyse cell numbers between E10.5 and E11.5. (c) Melanoblast numbers increase around ∼6-fold between E10.5 (n=25) and E11.5 (n=11) accompanied by an increase in axial width of ∼200 μm and in dorsoventral length of ∼1,000 μm. (d) Melanoblast mid-trunk density at E12.5 (n=8), E13.5 (n=8), E14.5 (n=32) and E15.5 (n=7) accompanied by linear increases in axial width of ∼900 μm and dorsoventral length of ∼3,200 μm (between E12.5 and E15.5). (e) The diffusion coefficient (D) was defined for each time-lapse experiment (n=20 E14.5 wild-type samples) and the values plotted against the initial density for each time-lapse. Pearson's product-moment correlation indicates a significant negative correlation between diffusion (D) and density (r=−0.49, degrees of freedom (df)=18, P=0.026). The functional form of the relationship between the diffusion coefficient and the cell density is recapitulated as an emergent property of the model (red line). (f) Analysis of cell cycle time (Tc) in E14.5 time-lapse sequences (n=19 wild-type samples). Pearson's product-moment correlation indicates a significant positive association between cell cycle time (Tc) and density (r=0.55, df=17, P=0.016). The functional form of the relationship between cell cycle time (Tc) and cell density described is as an emergent property of the stochastic model (red line). Scale bars in a, 1,500 μm; in b, 1,000 μm. Whiskers in bold=maximum and minimum of all data. The boxes enclose the 2nd and 3rd quartiles.

