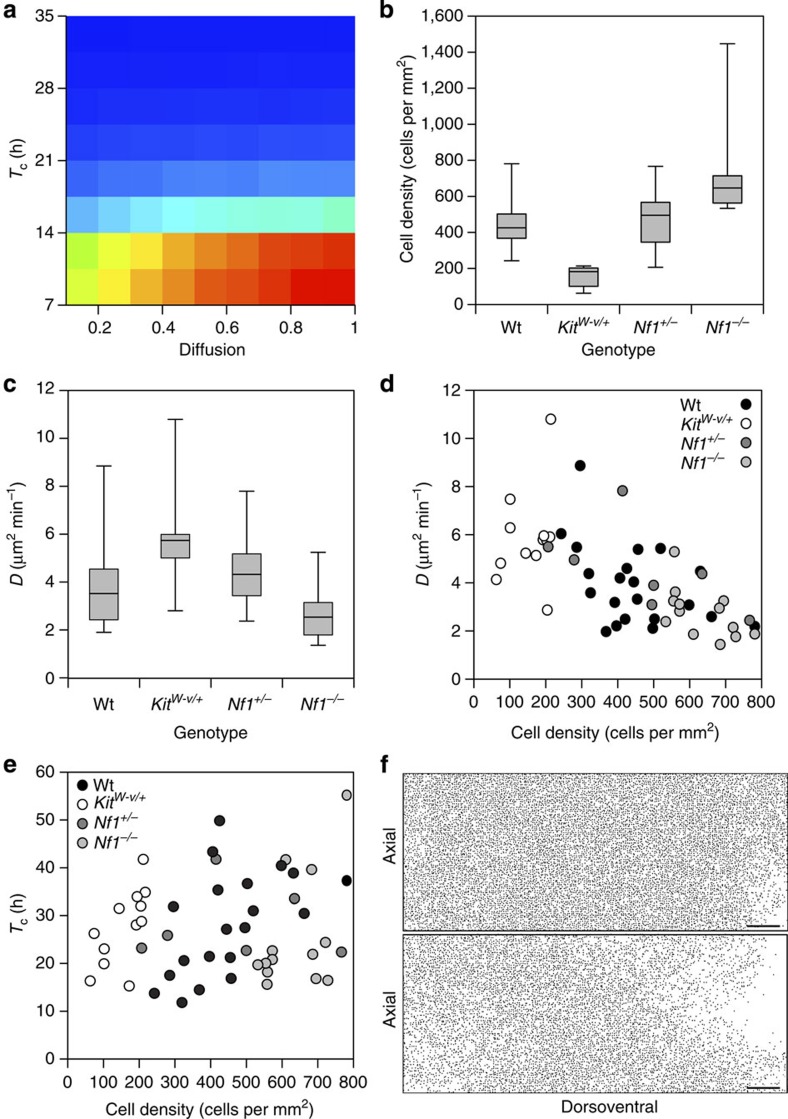
Figure 6. Reduced proliferation results in belly-spot formation.
(a) A heat map generated from a parameter sweep comparing colonization in the model for different values of diffusion (normalized with respect to D0, the diffusion coefficient used in our simulations) and cell cycle time (Tc). The model is substantially more sensitive to changes in Tc than in diffusion as indicated by the red region (blue: low probability of colonization; red: high probability of colonization). In all, 100 repeats of the model were performed for each combination. (b) Mid-trunk melanoblast densities of Kit+/+; Nf1+/+ (n=20), KitW-v/+; Nf1+/+ (n=12), Kit+/+; Nf1+/− (n=7) and Kit+/+; Nf1−/− (n=14) embryos. Melanoblast density is reduced in KitW-v/+; Nf1+/+ mice and is increased in Kit+/+; Nf1−/− mice. One-way analysis of variance (ANOVA) P<0.0001, Tukey's honest significant difference test (Tukey's HSD) P<0.001 in both cases. (c) Melanoblast diffusion coefficients (D) for Kit+/+; Nf1+/+ (n=21), KitW-v/+; Nf1+/+ (n=12), Kit+/+; Nf1+/− (n=7) and Kit+/+; Nf1−/− (n=14) embryos. Diffusion is increased in KitW-v/+; Nf1+/+ mice despite the failure of the melanoblast population to completely colonize the dorsoventral domain (one-way ANOVA P<0.0001, Tukey's HSD P<0.01). (d) Plot of D against density for Kit+/+; Nf1+/+ (n=20), KitW-v/+; Nf1+/+ (n=12), Kit+/+; Nf1+/− (n=7) and Kit+/+; Nf1−/− (n=14) embryos. Pearson's product-moment correlation indicates a significant negative association (r=−0.62, df=51, P<0.0001). (e) Plot of Tc against cell density for Kit+/+; Nf1+/+ (n=19), KitW-v/+; Nf1+/+ (n=12), Kit+/+; Nf1+/− (n=7) and Kit+/+; Nf1−/− (n=14) embryos. Pearson's product-moment correlation indicates no association (r=0.26, df=50, P=0.058). (f) An increase in Tc (from 7 to 10 h) results in a ventral belly spot in our simulations qualitatively similar to the pattern observed in KitW-v/+ mice (t=5 days, equivalent to E15.5). Each plot represents one side of the embryo extending from the dorsal most aspect on the left to the ventrum on the right. Scale bars in f, 500 μm. Wt, wild type. Whiskers in b, c=maximum and minimum of all data. The boxes enclose the 2nd and 3rd quartiles.

