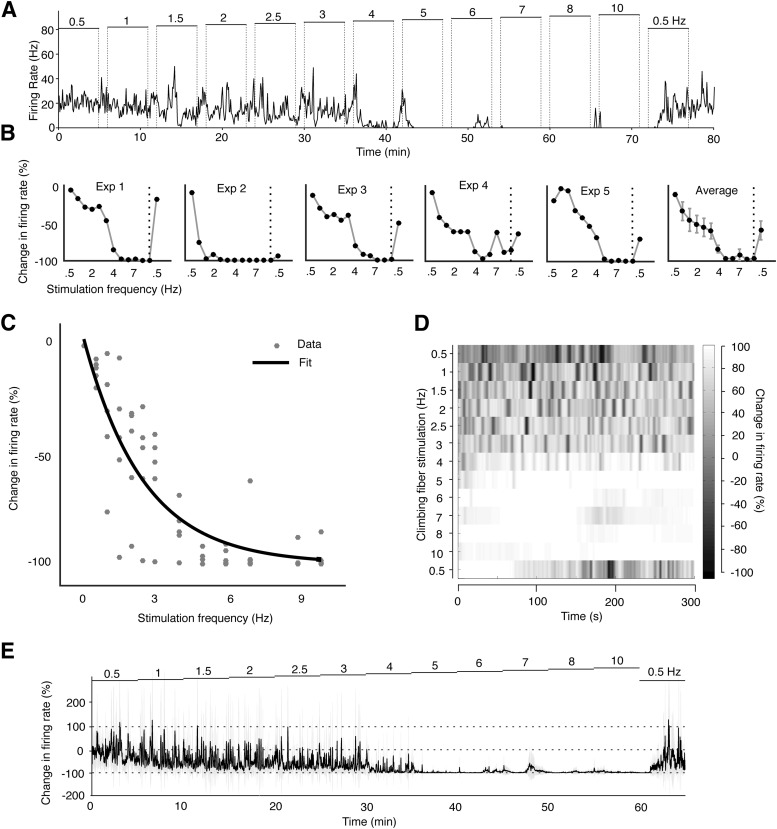
Figure 2.
Stimulating climbing fibers suppresses Purkinje cell activity in a frequency dependent manner. A, Time course of the simple spike suppression in a Purkinje cell during a complete experimental session. Climbing fibers were stimulated with electrical pulses (duration, 0.1 ms; intensity, 240 μA), for 5 min at incremental frequencies, with 60 s breaks in between each switch in frequency. The firing rate was estimated through convoluting the spike train with a Gaussian kernel (sigma, 2 s). B, Change in Purkinje cell activity as a function of the climbing fiber stimulation frequency in each of the five cells, as well as the average change (right). C, Scatterplot illustrating the relation between the climbing fiber stimulation frequency on the x-axis and changes in Purkinje cell activity on the y-axis. The data fits an exponential curve (black line) described by a coefficient of 0.397. The best fit was obtained through the Matlab Curve fitting toolbox (MathWorks). D, Average raster plot of simple spike firing rate changes over time. The color of the shadings indicates simple spike activity changes relative to the pre-stimulation baseline (baseline = 0%). Lighter areas indicate inhibition of simple spike firing (i.e., 100% equals a complete suppression) and darker areas indicate increased activity. E, Time course of the simple spike activity changes over the entire stimulation session averaged for the five experiments. Each data point corresponds to the firing rate change over a 100 ms window. Light gray shadings represent a 95% confidence interval.

