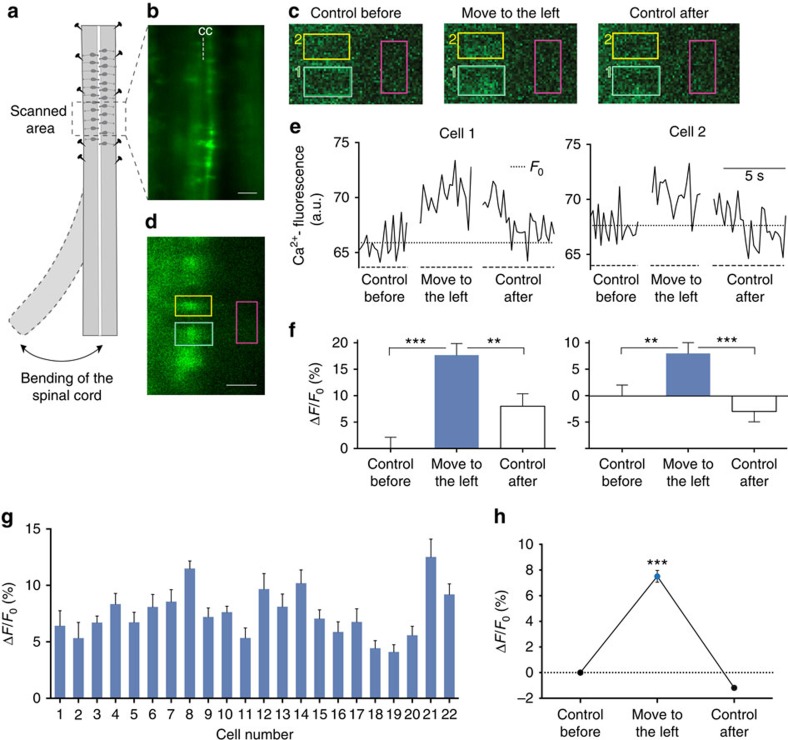
Figure 7. Calcium-imaging during imposed movement of the spinal cord.
(a) Schematic drawing illustrating the experimental design, with the movable, caudal part of the isolated spinal cord and the rostral part firmly fixed. Live imaging was performed in the area indicated. (b) fluorescence overview image within the scanned area, showing two rows of retrogradely filled CSF-c cells on either side of the central canal (cc). (c) Image frames from scanning (5 frames per second) before imposing a bending movement (control before), during bending to the left, and after return to the control position (control after). Two measurement regions placed over two CSF-c neurons (green and yellow) are indicated, as well as a reference region for measuring background fluorescence (red). Increased fluorescence intensity can be seen during bending in both cells. (d) Overview image from the same preparation as in c, with the corresponding measurement regions indicated. Image scanned at slow frame rate with higher spatial resolution and longer pixel dwell time to better visualize the cells recorded from. (e) Ca2+ fluorescence traces of the cell regions in c,d during scanning in the control position, during lateral bending and after return to the control position. Dotted line indicates the mean baseline fluorescence level before movement (F0). (f) The increase of fluorescence, (ΔF/F0), was highly significant in both CSF-c neurons following the bending movement (cell 1: ***P<0.0001; cell 2: **P<0.01; Student's t-test). After return to the control position, mean fluorescence intensity significantly decreased in both cells. (g) Corresponding data from 22 neurons are analysed, with significantly increased fluorescence intensities (ΔF/F0) during bending in each cell. Student's t-test: P<0.05 to P<0.0001. (h) Pooled data from all cells, showing a significant mean increase in fluorescence (7.5%; ΔF/F0) during bending of the spinal cord (***P<0.0001, Student's t-test). The data in f–h are represented as means±s.e.m. Scale bars, (b) 50 μm; (d) 20 μm.

