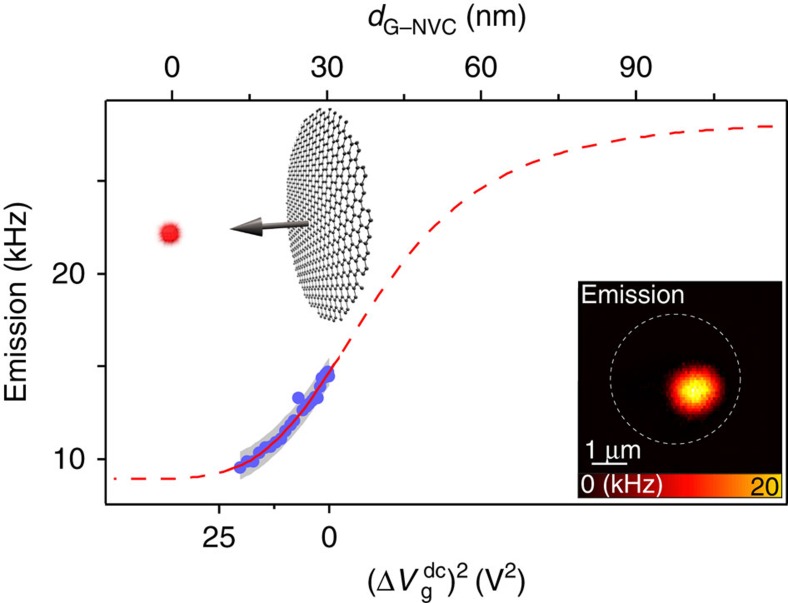
Figure 2. In situ electromechanical control of dipolar coupling.
Dependence of measured NVC emission intensity (blue) on the graphene-emitter separation dG–NVC, controlled by electrostatic deflection of the membrane. With increasing  , the membrane approaches the NVC, thereby reducing dG–NVC and quenching the NVC emission. Data can be fitted with an n-RET model (red), which also allows deflection calibration. For large separations, the extrapolated emission rate agrees with measured emission of nanodiamonds in the absence of graphene. The grey band is an uncertainty interval of width 1,500 Hz, estimated in detail in the Supplementary Note 6. Inset: optical emission map of the hybrid system showing localized NVC emission (dashed line: graphene resonator outline).

