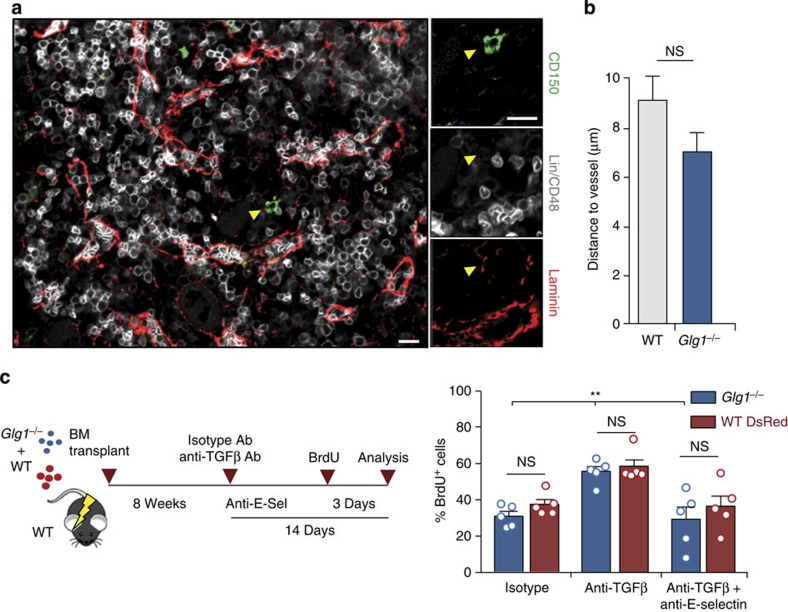
Figure 4. ESL-1 and E-selectin induce HSPC proliferation through independent mechanisms.
(a) Representative images of the distribution of LinNEG CD48NEG CD150+ cells in the BM relative to lamininHI (red) vessels; arrowheads indicate the position of a scored cell. Scale bars, 10 μm. n=7–9 mice, 55–70 cells per group. (b) Distances of LinNEG CD48NEG CD150+ cells to vessels in WT or Glg1−/− BM. NS, not significant, as determined by Student's t-test. n=39 or 40 cell per group. (c) Experimental design and percentage of BrdU+ LSK cells from each donor (WT-DsRed or Glg1−/−) in mixed chimeric mice treated with isotype-matched, anti-TGFβ alone or anti-TGFβ plus anti-E-selectin antibodies. n=5. Bars show mean±s.e.m. Each circle represents a mouse. **P<0.01 by one-way analysis of variance with Turkey's test comparing Glg1−/−cells across the different groups; NS, not significant.

