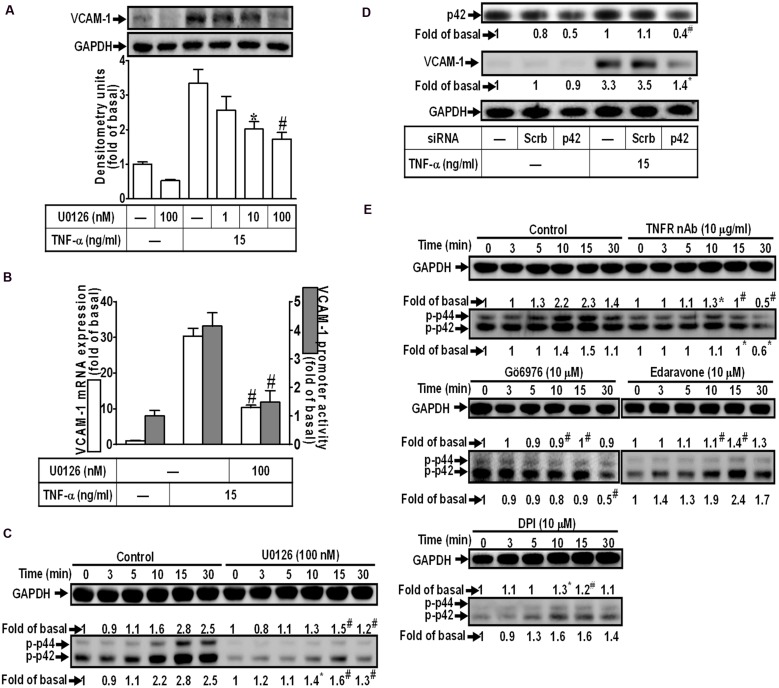
FIGURE 4.
TNF-α-induced VCAM-1 expression is mediated through p44/p42 MAPK in HCFs. (A) HCFs were pretreated with U0126 (1, 10, or 100 nM) for 1 h, and then incubated with TNF-α for 16 h. The protein levels of VCAM-1 were determined by Western blot. (B) HCFs were pretreated with U0126 (100 nM) for 1 h, and then incubated with TNF-α for 4 h. The mRNA expression (white bar) and promoter activity (gray bar) of VCAM-1 were determined by real-time PCR or promoter report assay, respectively. (C) HCFs were pretreated with U0126 (100 nM) for 1 h, and then incubated with TNF-α for the indicated time intervals. The levels of phospho-p44/p42 MAPK were determined by Western blot. (D) HCFs were transfected with either scrambled or p42 siRNA, and then incubated with TNF-α for 16 h. The levels of p42 and VCAM-1 protein were determined by Western blot. (E) HCFs were pretreated without or with TNFR nAb (10 μg/ml), Gö6976 (10 μM), edaravone (10 μM), or DPI (10 μM) for 1 h, and then incubated with TNF-α for the indicated time intervals. The levels of phospho-p44/p42 MAPK were determined by Western blot. Data are expressed as mean ± SEM of three independent experiments (n = 3, Quantitative data of Figures 4C–E were presented in Supplementary Table S1). ∗P < 0.05; #P < 0.01, as compared with the cells exposed to TNF-α alone.

