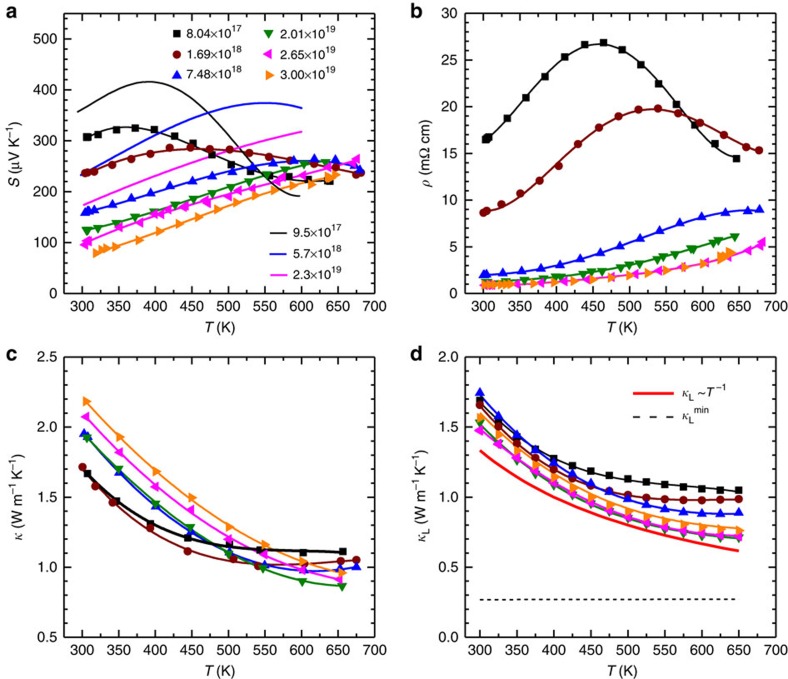
Figure 3. Transport properties as a function of temperature.
Seebeck coefficient (a) resistivity (b) total thermal conductivity (c) and lattice thermal conductivity (d) for p-tellurium. The ab initio calculated Seebeck coefficient46 is included as solid curves for comparison in a. Majority of the samples studied here show a degenerate p-type semiconducting behaviour and a dominant phonon scattering by Umklapp process (red curve in d). The black dashed line in d shows the estimated minimal lattice thermal conductivity (κLmin) according to the Cahill model. Overlying lines are used to guide the eye and the carrier concentrations for the samples are shown in a unit of cm−3 in a.

