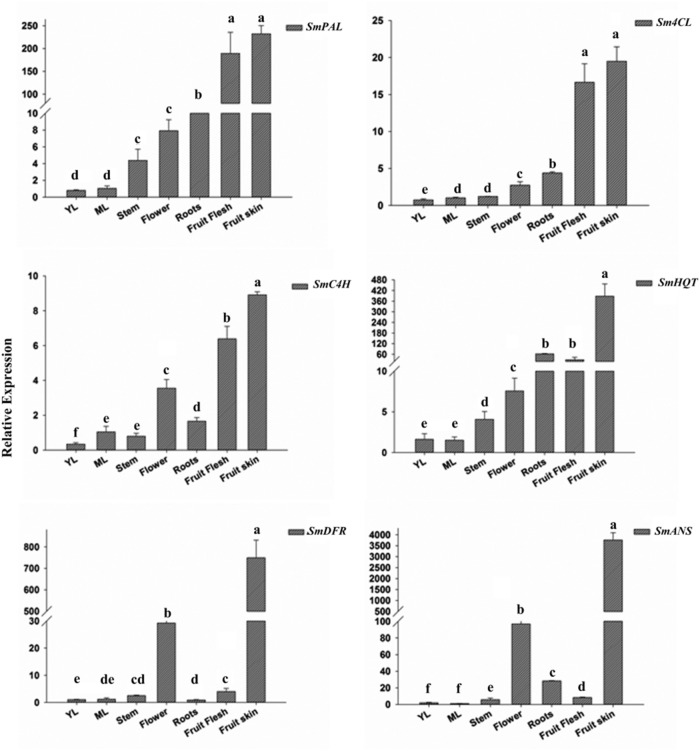
FIGURE 2.
Relative transcript levels of SmPAL, SmC4H, Sm4CL, SmHQT, SmDFR, and SmANS in various Solanum melongena organs and at two leaf development stages (YL, young leaves and ML, mature leaves). The results were analyzed using the ΔΔCt method and presented as fold changes compared with the young leaves, used as internal calibrator. Data are reported as means ± SD. Means denoted by the same letter did not differ significantly at p ≤ 0.05 according to Duncan’s multiple range test.

