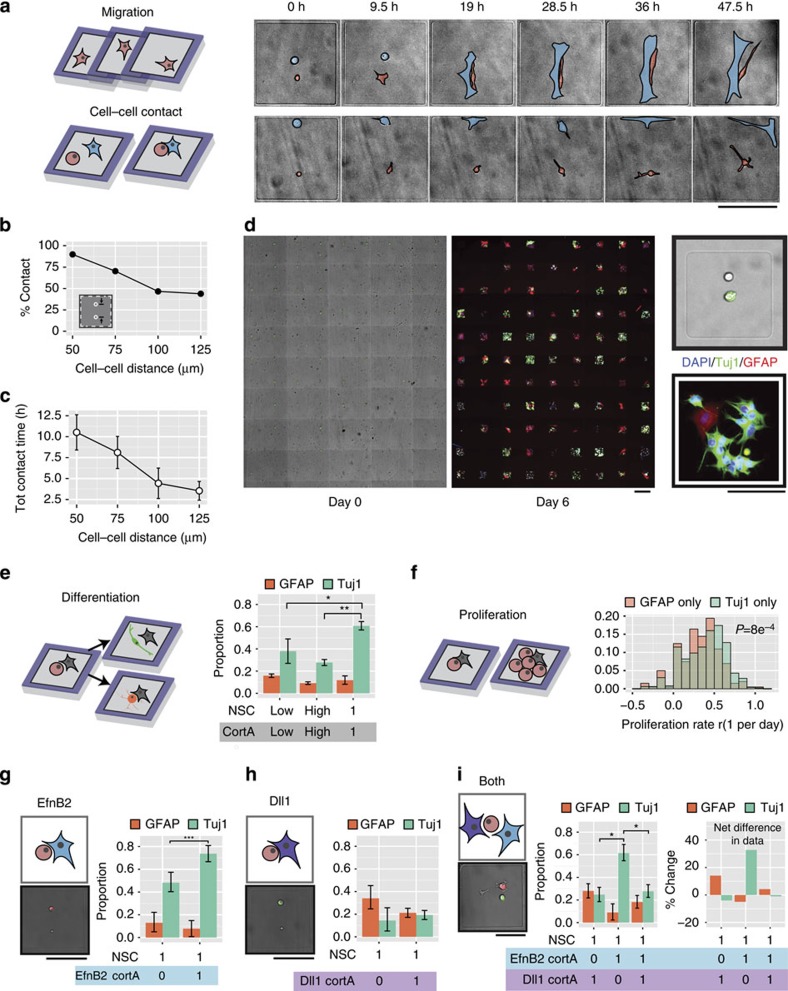
Figure 3. Arrays of cellular communities yield insights into cell dynamics and NSC differentiation, proliferation and signal arbitration of opposing juxtacrine signals at the single-cell level.
(a) Migration and cell–cell contact for each microisland can be tracked with time-lapse microscopy. Representative 48-h time-lapse images illustrating the dynamics of two NSC–astrocyte pairs initially patterned at different separations. NSC highlighted in red, and astrocyte highlighted in blue. (b) Percent of cellular communities that showed contact increased as the initial distance separating NSC and astrocyte decreased. (c) Total contact times also increased as initial cell–cell distance decreased. (d) Cell communities could be repeatedly imaged over long timescales with subsequent visualization of differentiation markers. Representative, stitched montages of NSCs (upper) and cortical astrocytes (lower, green) immediately after patterning (left), then after immunostaining after 6 days for the neuronal marker Tuj1 and astrocyte marker GFAP (right). Higher magnification of a representative adhesive microisland shows that all progeny of this particular single NSC founder differentiated into Tuj1+ neurons. (e) NSC differentiation can be tracked for each community. When patterned with single naive astrocytes, NSCs exhibited enhanced Tuj1 differentiation and similar GFAP differentiation when compared with low-density and high-density bulk co-cultures. (f) Microisland confinement enabled analysis of proliferation rates. Proliferation rates (r) for Tuj1-biased lineages (lineages in which no GFAP cells were present) were higher than proliferation rates for GFAP-biased lineages (P=8e−4). (g) NSCs patterned with a single hEfnB2-overexpressing astrocyte exhibited enhanced Tuj1+ differentiation. (h) NSCs patterned with a single hDll1-overexpressing astrocyte displayed low Tuj1 expression. (i) When a single NSC was in the presence of both a Dll1 astrocyte and an EfnB2 astrocyte, the Dll1 phenotype (that is, reduced Tuj1) dominated. The left graph represents immunostained proportions of NSCs in each condition, and the right graph depicts immunostaining changes compared with NSCs patterned 1:1 with a naive cortical astrocyte. All error bars are 95% confidence intervals; all P values obtained from t-test. ***P<0.001, **P<0.01, *P<0.05. All scale bars, 100 μm.

