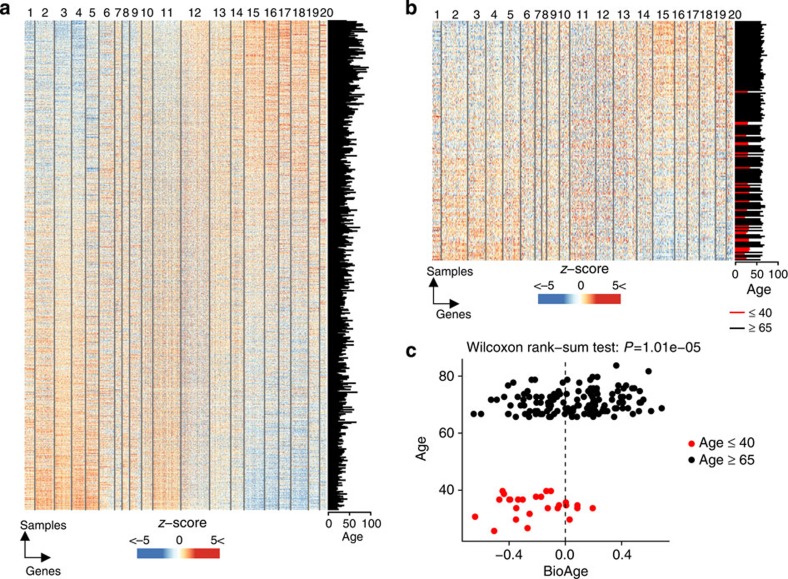
Figure 2. Development of the BioAge signature and application to the EM131 cohort.
(a) Expression of the 2,285 age-related transcripts derived from SAFHS data set (n=1,240)19; all transcripts correlating with chronological age (moderated t-test: adjusted P≤0.05) were clustered in 20 modules using k-means clustering. In the heat map, transcripts (columns) were ordered by their membership to the 20 modules; the 1,240 samples/participants (row) were ordered by their BioAge score (signed average expression of the age-related transcripts). Transcript expression was transformed to z-score and is depicted in blue to white to red colour scale. The chronological age is given in the bar plot at the right. (b) Expression of the 2,285 transcripts of the BioAge signature in the EM131 data set (n=174). The chronological age of the 174 participants is given in the bar plot at the right. (c) Scatter plot showing the chronological age as a function of the BioAge. The vertical line indicates a BioAge score of 0. We observe that young participants (red circles) have significantly younger BioAge; and among elderly (black circles) about half of participants have a young BioAge (<0) while the other half have an old BioAge (oAge).

