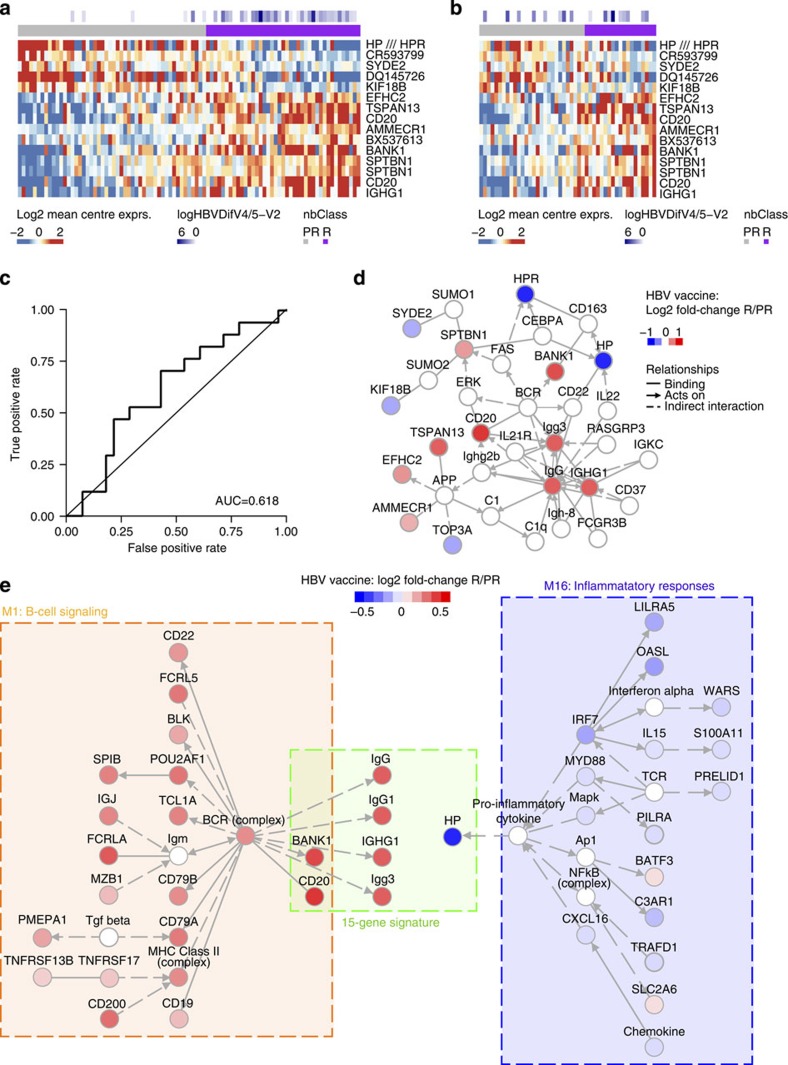
Figure 4. Identification of gene-expression signature predicting the HBV vaccine response.
(a) Expression of 15 genes identified as predictors of the response to the HBV vaccine in the EM131 training set (n=95). The mean-centred gene expression is represented using a blue to white to red colour scale. Rows and columns correspond to the genes and the profiled samples, respectively. Samples were ordered by increasing levels of their predicted probability of responding to the vaccine (that is, posterior probability). Antibody response to the HBV vaccine (log(HepBDifV4/5-V2)) and the response group predicted by the 15-gene signature (nbClass) are presented in coloured squares above each sample. (b) Expression of the 15-gene signature on the EM131 test set (n=49). (c) ROC curve and area under the curve (AUC) for the prediction of the HBV vaccine response using the 15-gene signature on the EM131 test set (n=49). (d) Network inference based on the 15 markers identified as predictors of the response to the HBV vaccine. Red and blue nodes represent genes induced or repressed in HBV vaccine responders (R) compared with poor-responders (PR), respectively. (e) Networks were inferred for the BioAge module 1 combined to the 15-gene signature and the BioAge module 16 combined to the 15-gene signature, respectively. Nodes included in the BioAge or the 15-gene signature are coloured by their fold-change between R versus PR to the HBV vaccine in the EM131 training set.

