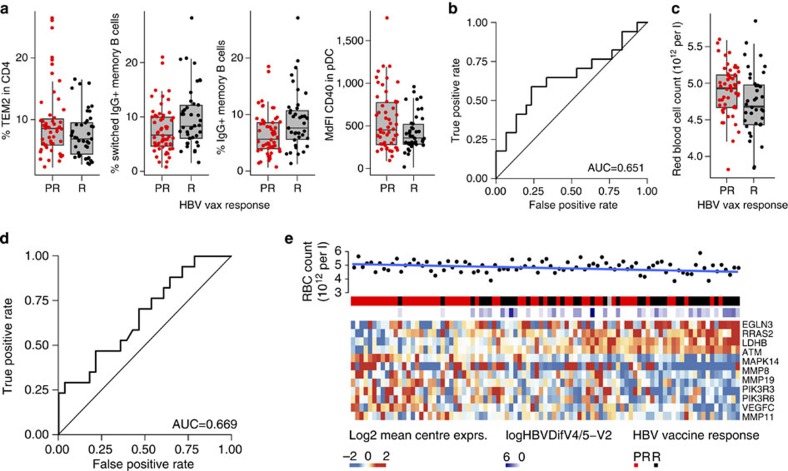
Figure 5. B-cell subset as well as innate immune cell subsets and RBC counts are predictive of the response to the HBV vaccine.
Polychromatic FCM was used to identify cell surface markers of the response to the HBV vaccine. (a) Box plots presenting the frequencies of the four FCM markers selected in the forward selection model in responders and poor-responders to the HBV vaccine on the EM131 training set (n=95). (b) ROC curves for the prediction of the HBV vaccine response using the FCM data on the EM131 test set. (c) Box plots presenting the RBC counts (measured in a 28-day window prior to HBV vaccination) in responders and poor-responders to the HBV vaccine on the EM131 training set (n=95). (d) ROC curves illustrating the prediction of the HBV vaccine response using RBC counts on the EM131 test set. (e) Heat map representation of the genes differentially expressed between HBV vaccine R and PR overlapping the HIF-1a canonical pathway in the training set. The mean-centred gene expression is represented using a blue–red colour scale. Rows and columns correspond to the genes and the profiled samples, respectively. Samples were ordered by increasing level of their expression of the genes associated to the vaccine response (mean-rank ordering). Antibody response to the HBV vaccine (logHepBDifV4/5-V2) and HBV vaccine response group (HBV vaccine response) and red blood cells counts (RBC in 1012 per l) are presented in coloured squares above each sample. The P value of t-test between RBC and the ordering of the samples is 0.0462.

