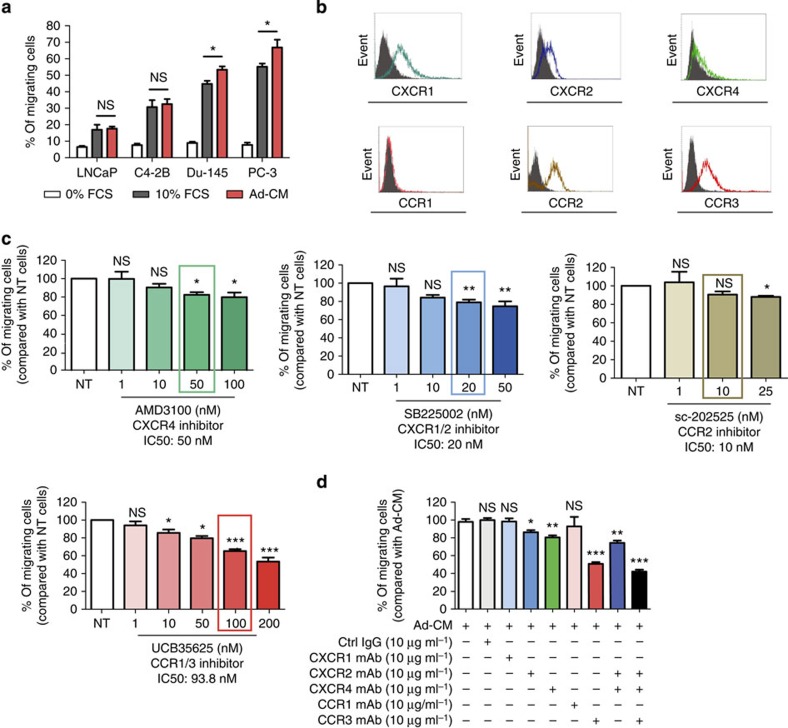
Figure 1. Adipocytes promote the migration of prostate cancer cells in a CCR3-dependent manner.
(a) In vitro migration of the indicated prostate cancer cell lines towards a medium containing either 0% (used as a negative control) or 10% FCS, or towards conditioned medium obtained from 3T3-F442A mature adipocytes (Ad-CM). Data are shown as mean±s.e.m. (n=5). (b) One representative experiment out of three showing the expression of chemokine receptors (CXCR1, CXCR2, CXCR4, CCR1, CCR2 and CCR3) detected by flow cytometry in the human prostate cancer cell line, PC-3. Solid histogram: control isotypes; open histogram: indicated antigens. (c) In vitro migration towards Ad-CM in the presence of increasing doses of the indicated receptor antagonists. Cells were pre-incubated with the receptor antagonists for 30 min at 37 °C before their addition to Transwell chambers. The receptor antagonists were also present during the migration assay (12 h). The molecules were used within a range of doses that inhibit chemotaxis; the line surrounding the histogram indicates the previously described IC50 of the inhibitors in chemotaxis experiments. Data are shown as mean±s.e.m (n=3). (d) Similar experiments were performed in the presence of blocking monoclonal antibodies (mAbs) directed against CXCR1, CXCR2, CXCR4, CCR1, CCR3 or control IgG at 10 μg ml−1 used alone or in combination. Bar plots represent the percentage of migrating cells relative to the migration of untreated cells (set to 100%). Data are shown as mean±s.e.m (n=3). The statistical significance of differences between means of migrating cells (in %) in treated versus untreated (NT) cells was evaluated with Student's t-tests. Statistical analysis: * statistically significant by Student's t-test P<0.05, **P<0.01, ***P<0.001, NS, not significant. n stands for the number of replicated independent experiments.

