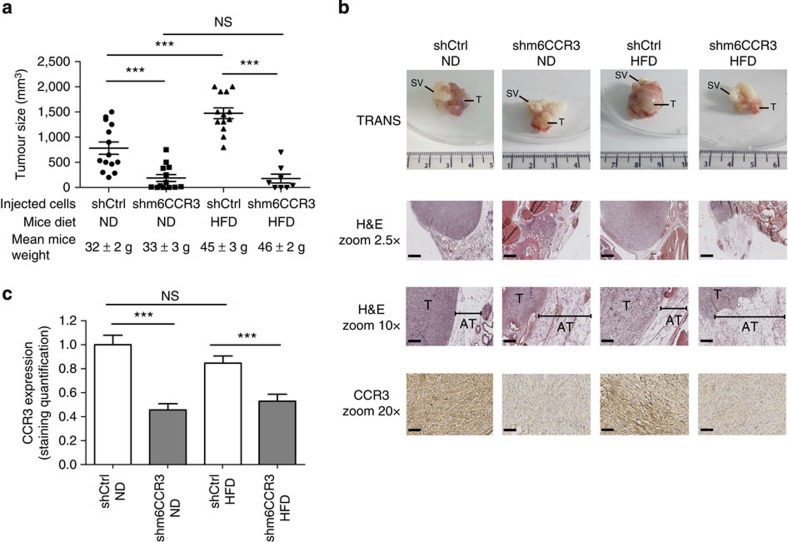
Figure 6. CCR3 contributes to prostate cancer progression in vivo and this event is regulated by obesity.
(a) GFP-tagged shCtrl or m6CCR3 transfected TRAMP-C1P3 cells were injected into the prostate (dorsal lobe) of 18 week-old C57BL/6 mice fed a standard rodent diet (normal diet, ND) or a high-fat diet (HFD). Graphs depict the tumour volume measured 21 days after injection. The mean weight of the mice before the injection, as well as the mean tumour size±s.e.m. in each group, is shown on the legend (N⩾8 tumours per group). (b) Representative photograph of a tumour from each group taken with white light (Trans) imaging (upper line of the picture; T, tumour; SV, seminal vesicles). The three other lines represent tumour sections from each group after hematoxylin-eosin (H&E) coloration (top and middle, T, tumour; AT, adipose tissue) and CCR3 staining in tumours (lower line). The hypertrophy of adipocytes in obese mice is shown by their comparison with adipocytes from lean mice in mice grafted with the shm6CCR3 cell line (mean size in ND: 56.47±16.63 μm versus mean size in HFD: 133.53±23.82 μm, P<0.001, as determined using ImageJ software). Scale bars, respectively, for 2.5, 10 and 20 × : 1 mm, 250 and 125 μm. (c) Quantitative expression of CCR3 staining with ImageJ. Data are shown as mean±s.e.m. (three tumours in each group with five fields per tumour). Statistical analysis: *** statistically significant by Student's t-test P<0.001, NS, not significant.

