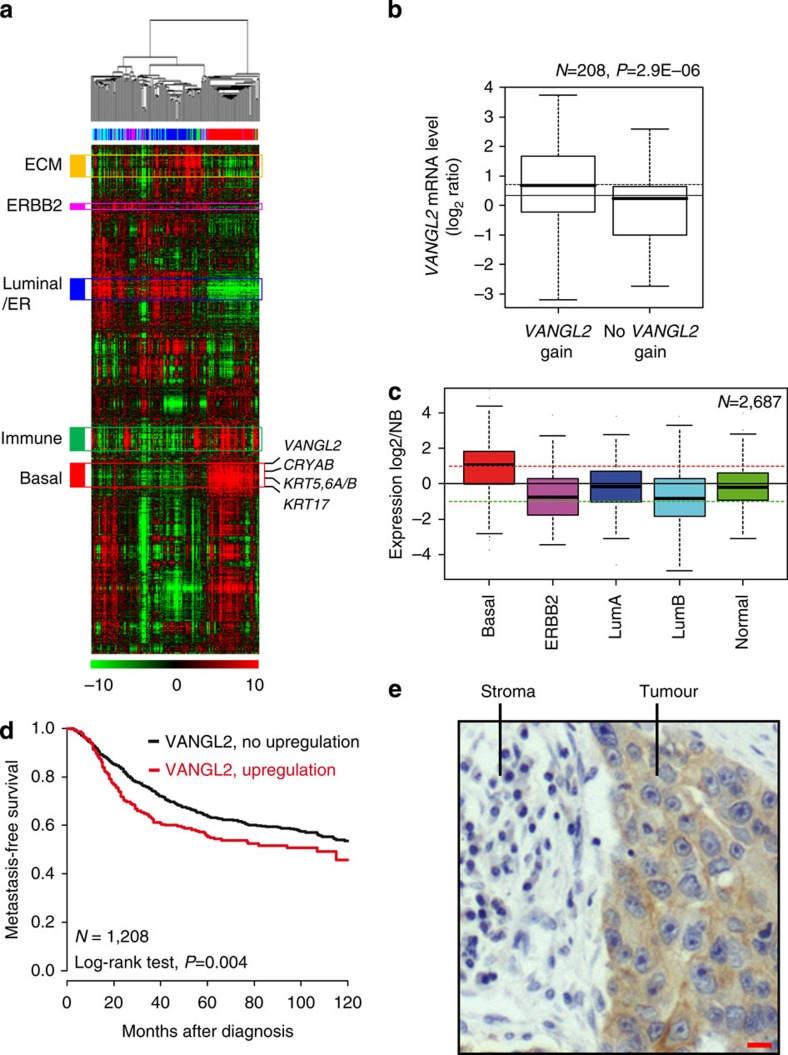
Figure 1. Overexpression of VANGL2 in breast cancer.
(a) Hierarchical clustering of the 208 breast cancers and 4 NB samples (columns) and the 12,304 most variable genes (rows). According to a log2 pseudocolour scale (bottom), red indicates a high level of mRNA expression compared with the median value across all samples, whereas green indicates a low level of expression. The magnitude of deviation from the median is represented by the colour saturation. The dendrogram of samples (above matrices) represents overall similarities in gene expression profiles. To the left of the colour matrix are represented some biologically relevant gene clusters (orange: extracellular matrix cluster (ECM); pink: ERBB2 cluster; blue: luminal/ER cluster; green: immune cluster; red: basal cluster). A few genes of the basal cluster are shown, including VANGL2, as well as classical basal genes (KRT5, KRT6, KRT17 and CRYAB). (b) Box and whisker plots of VANGL2 expression across 208 breast cancer samples profiled by both expression DNA arrays and aCGH, and according to (Student's t-test) VANGL2 genomic status: with (left, 104 samples) versus without (right, 104 samples) gain defined as a DNA copy number ratio tumour/NB⩾1.5). (c) Box and whisker plots of VANGL2 expression across 2,687 breast cancer samples according to molecular subtypes. Expression values are NB-centred. The horizontal black line represents the level of expression of VANGL2 in NB tissue. Differences between the subtypes were tested for significance using one-way analysis of variance (ANOVA). For each box and whisker plot, the median value and interquartile ranges are indicated. (d) Kaplan–Meier MFS curves in breast cancer patients according to VANGL2 mRNA expression. The 5-year MFS are 55% (upregulation; N=296) and 64% (absence of upregulation; N=912). (e) Immunohistochemistry experiment using anti-VANGL2 2G4 monoclonal antibody (mAb) shows that VANGL2 is more expressed in tumour cells (tumour) than in the stromal tissue (stroma) in basal breast cancer. Scale bar, 10 μM.

