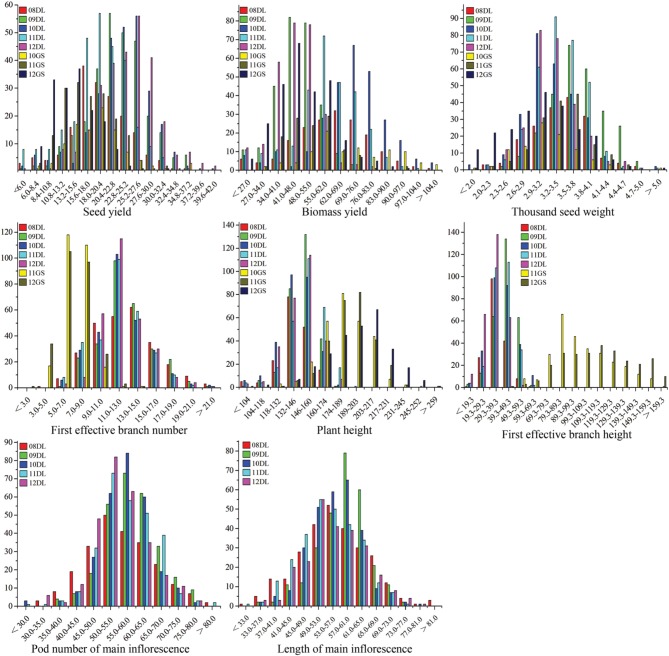
Figure 1.
The frequency distribution of SY and SYRTs in multiple environments. The units of the x-axis are the phenotypic values, and the units of the y-axis are the number of lines. SY and SYRTs in different experiments was discriminated using different colored boxes. A unit of measurement: seed yield (g), biomass yield (g), thousand seed weight (g), plant height (cm), first effective branch height (cm), first effective branch number, length of main inflorescence (cm), pod number of main inflorescence.

