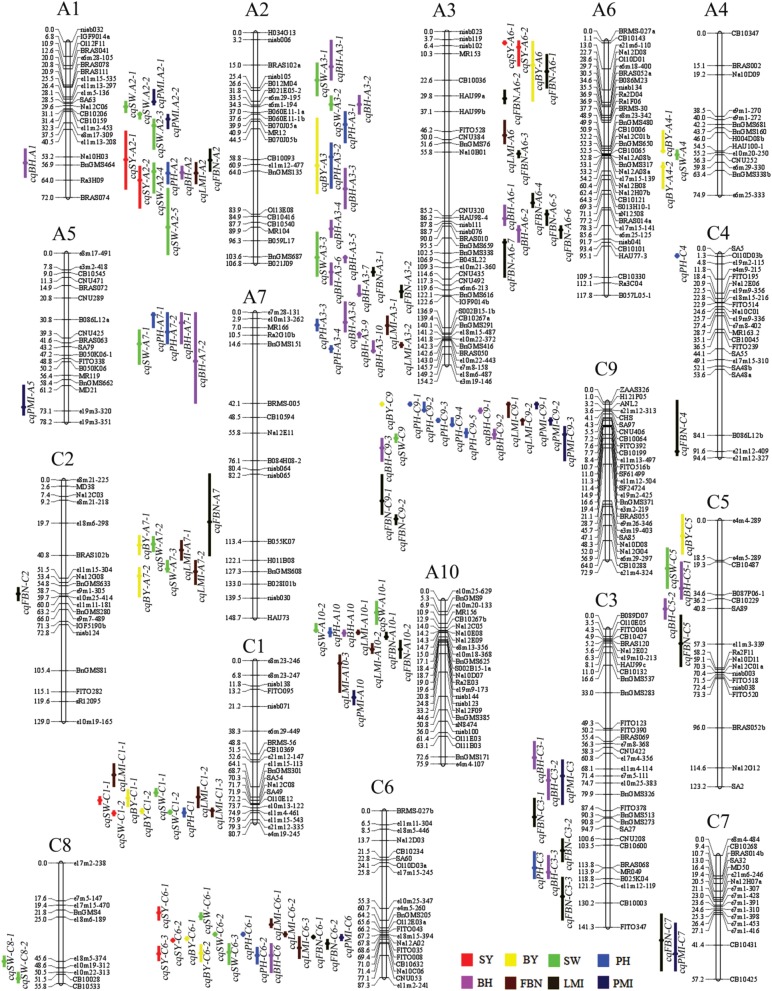
Figure 2.
Genetic linkage map and the location of QTLs for SY and SYRTs in the KN linkage map. The 144 consensus QTLs for SY and SYRTs were distributed on 18 linkage groups with the exception of A8, A1–A10 were represented by the A genome and C1–C9 were represented by the C genome in B. napus. The loci names were listed on the right of the linkage groups, while position of loci were showed on the left side of linkage groups. The consensus QTLs associated with SY and SYRTs were indicated by bars with various backgrounds on the left of each linkage group (Red bar, seed yield; Yellow bar, biomass yield; Green bar, thousand seed weight; Blue bar, plant height; Purple bar, first effective branch height; Brown bar, first effective branch number; Black bar, length of main inflorescence; Dark blue bar, pod number of main inflorescence).

