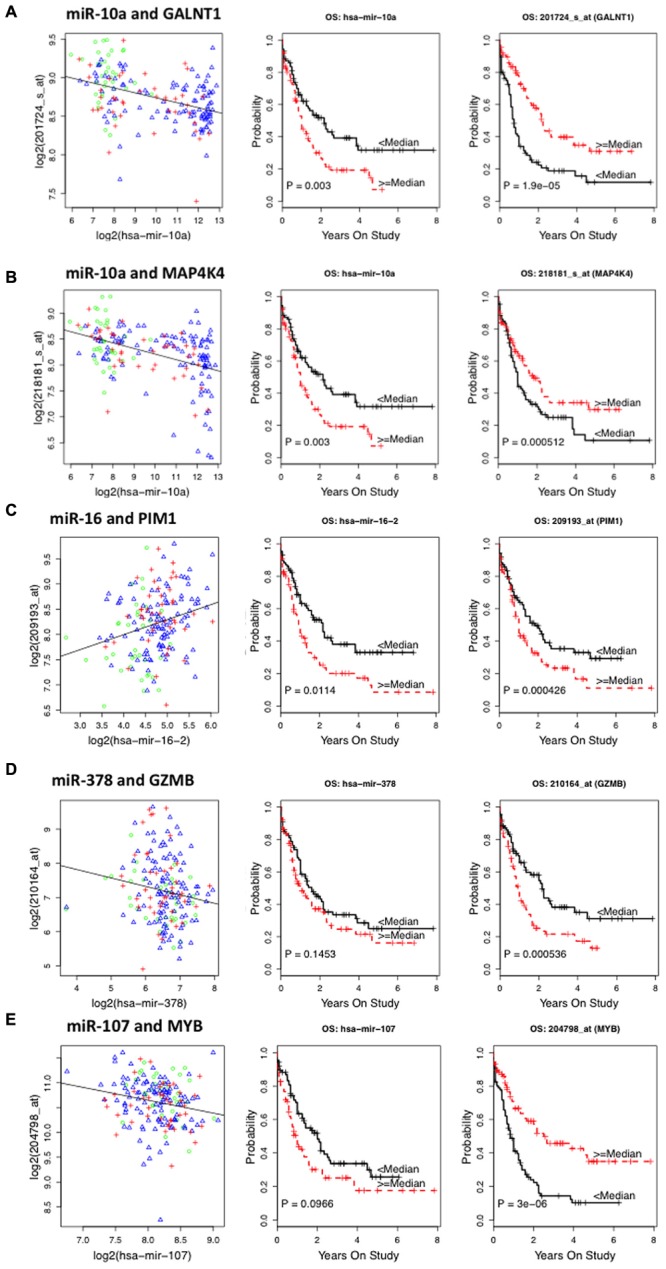
FIGURE 2.

Representative plots showing correlation between miRNA–target messenger RNA (mRNA) and survival curves of miRNA and mRNA expression with overall survival (OS) in AML patients from The Cancer Genome Atlas (TCGA) database. (A) Correlation plot of miR10a–GALNT1 mRNA levels and Kaplan–Meier survival curves of miR10a and GALNT1 expression with OS. (B) Plots for miR-10a–MAP4K4 pair. (C) Plots for miR-16 and Pim1 pair. (D) Plots for miR-378 and GZMB pair. (E) Plots for miR-107 and Myb pair.
