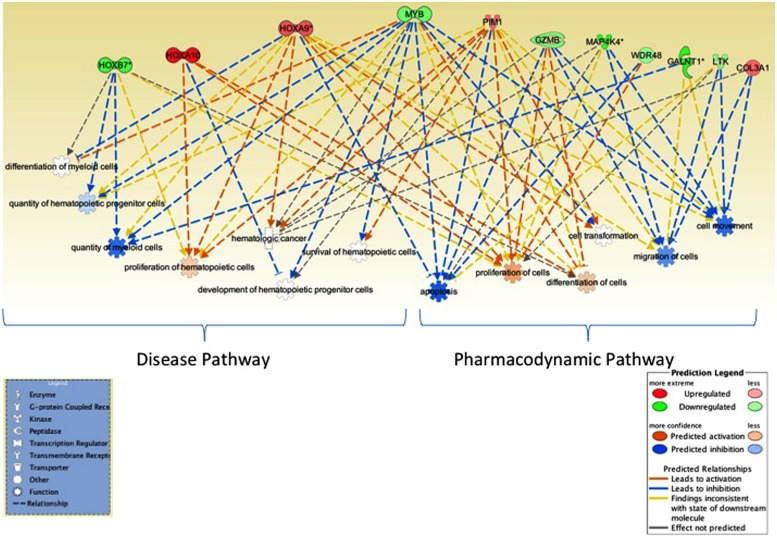
FIGURE 3.
Network analysis. Ingenuity pathway analysis tool was utilized to evaluate the genes identified in miRNA–mRNA-OS analysis. Several genes mapped to biological processes of relevance to hematological malignancies, myeloid leukemia as well as to cell proliferation and apoptosis, RNA expression. Genes associated with better OS are in green and ones with worse OS are in red.

