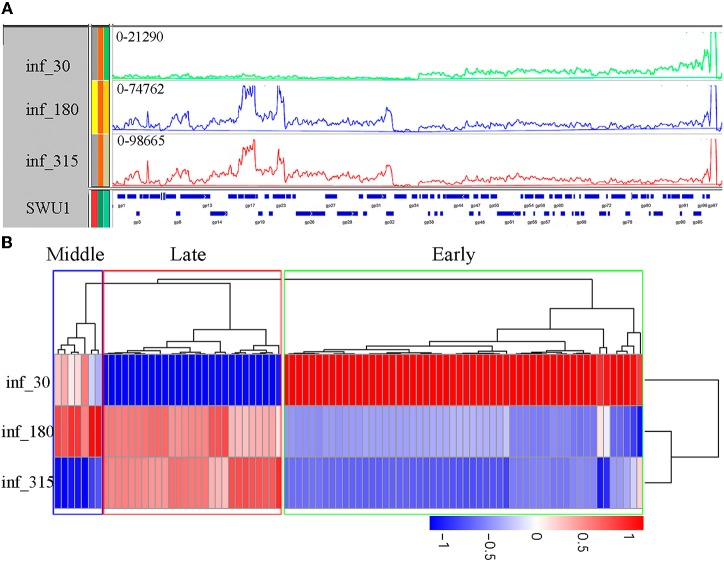
Figure 1.
Transcription of the SWU1 genome determined by RNA-seq. (A) Transcription patterns in the SWU1 genome determined by RNAseq. RNA was isolated during early SWU1 infection (green), middle SWU1 infection (blue), and late SWU1 infection (red). At all time points, one sample was taken for sequencing (Illumina HiSeqTM2000). The Y-axis is the number of RNAseq reads. The X-axis is the map of the SWU1 genome. (B) Cluster analysis of differentially expressed genes of SWU1. Based on log10 (RPKM+1), we cluster the differentially expressed genes in different phase of SWU1 infection. Red stands for high expressed genes; blue stands for low expressed genes. In early phase of SWU1 infection, a lesser number of genes were transcribed. Most of genes transcribed were located on the right arm of SWU1 genome. In middle and late phase of SWU1 infection, most of genes transcribed were located on the left arm of SWU1 genome.

