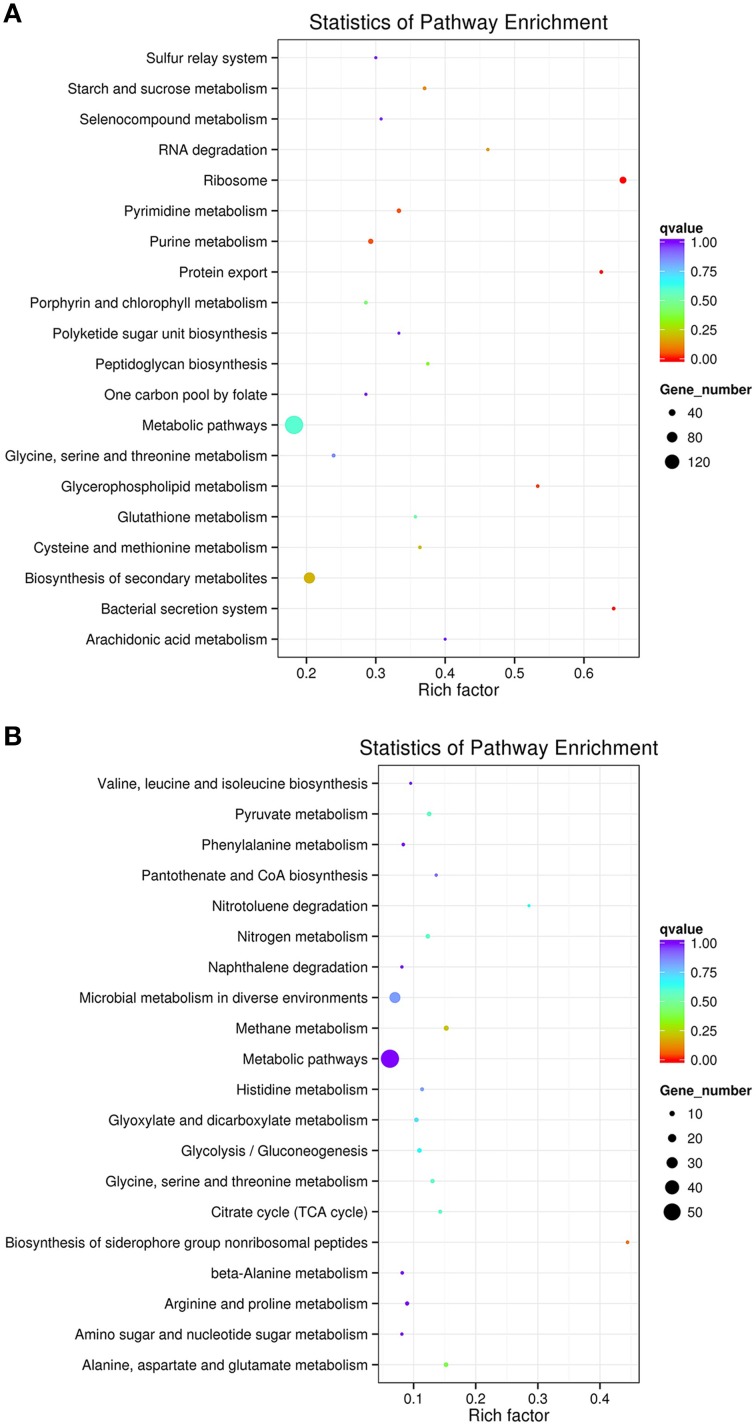
Figure 2.
The scatter plot of KEGG pathways enriched for differential expression genes. Panel (A) shows up-regulated pathways. Panel (B) shows down-regulated pathways. The Y-axis is different KEGG pathway. The X-axis is the number of rich factor. The color of circles stands for the q-value of pathway. The range of q value is from 0 to 1. The size of circles stands for gene number. Some up-regulated genes associated to ribosome, protein export, bacterial secretion system, glycerophospholipid metabolism, and RNA degradation were enriched. Some down-regulated genes associated to siderophore non-ribosomal peptides and nitrotoluene degradation were enriched.

