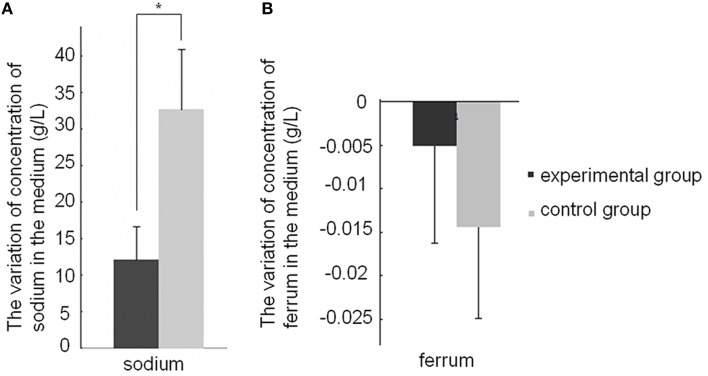
Figure 3.
Effect of the SWU1 infection on sodium and ferrum fluxes. (A) Positive value stands for the concentration of ions increased after SWU1 infected 30 min. (B) Negative value stands for the concentration of ions decreased after SWU1 infected 30 min. The capacity of sodium efflux was suppressed after SWU1 infected. Iron uptake system was disrupted by SWU1. The data were averaged from two independent experiments ± s.d. Significant differences (*p < 0.05).

