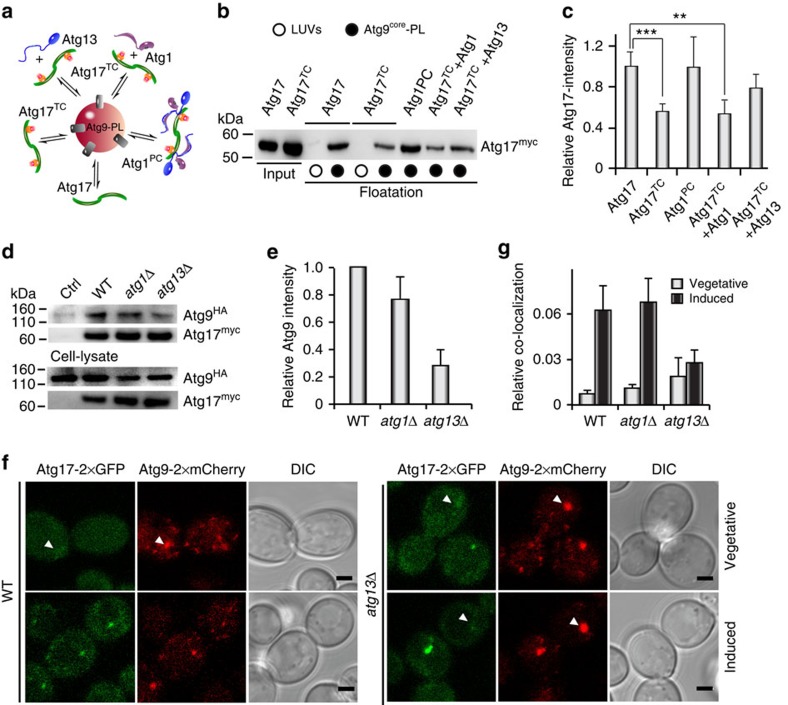
Figure 4. The activity of Atg17 is regulated by Atg31–Atg29 and Atg1–Atg13 subcomplexes in vitro and in vivo.
(a) The schematic drawing illustrates the experimental set-up of floatation assays. (b) α-myc immunoblot from co-floatation experiments of Atg9–PLs with recombinant myc-tagged Atg17 with and without other Atg1PC-subunits as indicated. Similar experiments with large unilamellar vesicles (LUVs) lacking Atg9core served as controls for unspecific membrane binding. Input corresponds to 10% of total protein used for co-floatation. (c) Semiquantitative analysis of immunoblots as shown in b from co-floatation experiments of Atg17myc with Atg9–PLs in the presence of other subunits of Atg1PC as indicated. All Atg17myc-intensities were corrected for Atg9-intensities. The band intensity of Atg17myc (w/o other Atg1PC-subunits) was set to one and used for normalization. Mean values±s.d. of N=3 independent experiments are shown. P values were calculated using two-tailed Student's T-test (*P<0.05; **P<0.01; ***P<0.005). (d) Immunoprecipitation (IP) of Atg17myc from lysates of wildtype (WT), atg1Δ and atg13Δcells after two hours of starvation. Atg17 and co-immunoprecipitated Atg9 were detected by α-myc and α-HA immunoblots as indicated. (e) Quantification of Atg9HA as shown in d. The intensity of the Atg9HA-band in wildtype (WT), atg1Δ, and atg13Δ cells were corrected for unspecific binding of Atg9HA in the control (Ctrl, cells w/o myc-tag). The WT Atg17-band intensity was set to one and used for normalization. Mean values±s.d. of N=3 independent experiments are shown. (f) Co-localization of Atg9-tandem-mCherry with Atg17-tandem-GFP in wildtype (WT) and atg13Δ cells under vegetative and autophagy-induced conditions. Arrowheads indicate positions of non-colocalizing Atg9-puncta. Scale bar, 2 μm. (g) Quantification of relative co-localization of Atg17-puncta with Atg9-puncta (number of co-localizing puncta per cell, normalized by number of Atg17 puncta per cell) in WT, atg1Δ, and atg13Δ cells under vegetative (white bars) and autophagy-induced (black bars) conditions. Mean values±s.d. of N=3 independent experiments are shown (>200 cells per strain were examined).

