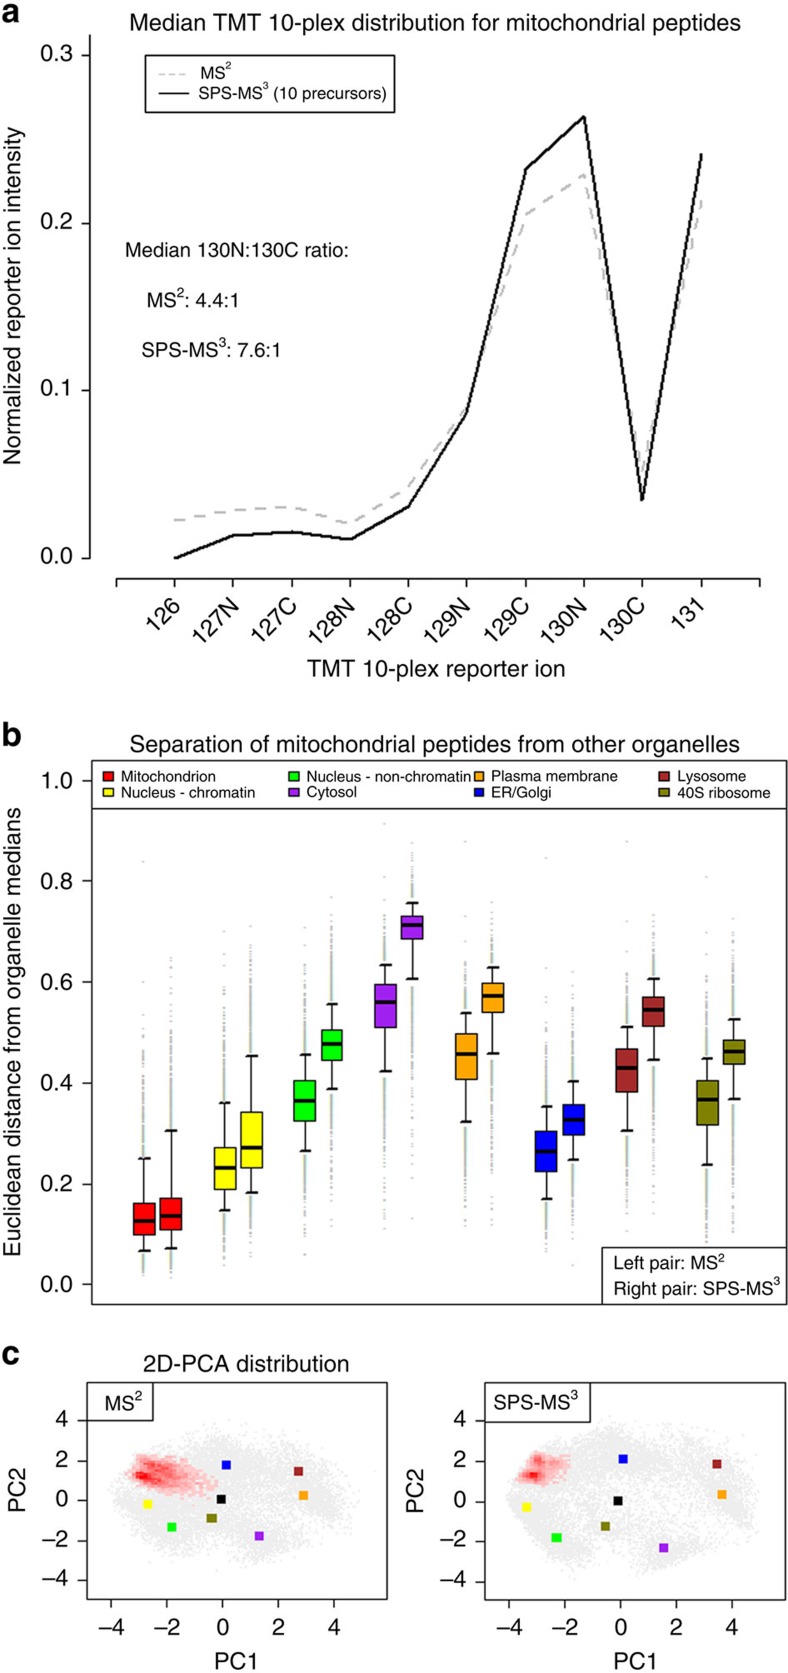
Figure 2. SPS-MS3 enhances resolution of the mitochondrion from other organelles.
(a) SPS-MS3 results in higher quantitative accuracy. The ratio between TMT channels expected to be enriched in mitochondria (129C and 130N) and channels that are expected to be depleted (for example, 130C) is markedly increased by SPS-MS3. (b) The distance of mitochondrial PSMs from the median of eight organellar phenotypes. The distance of mitochondrial PSMs from the median mitochondrial distribution does not change significantly between MS2 and SPS-MS3, but the distances from other organelles are all significantly increased in SPS-MS3 (Wilcoxon rank sum test P value <2.2 × 10⁻¹⁶), indicating greater organellar resolution. (c) When represented in two dimensions by PCA, the mitochondrial PSMs (red heat map) show less skew towards the origin, due to the improved specificity of SPS-MS3 quantification. The median positions of other organelles are represented by coloured squares and individual proteins by grey points. Similar plots demonstrating the enhanced resolution of other organelles are presented in Supplementary Fig. 2.

