
Figure 7.
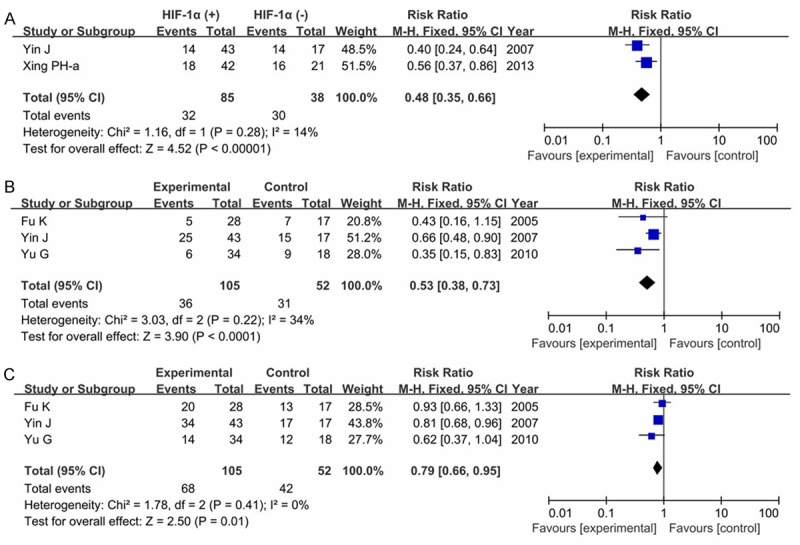
Forest plot of association between HIF-1α expression and overall survive (OS) in glioma patients (A. 3-year OS; B. 2-year OS; C. 1-year OS).
Official websites use .gov
A
.gov website belongs to an official
government organization in the United States.
Secure .gov websites use HTTPS
A lock (
) or https:// means you've safely
connected to the .gov website. Share sensitive
information only on official, secure websites.
Forest plot of association between HIF-1α expression and overall survive (OS) in glioma patients (A. 3-year OS; B. 2-year OS; C. 1-year OS).