
Figure 6.
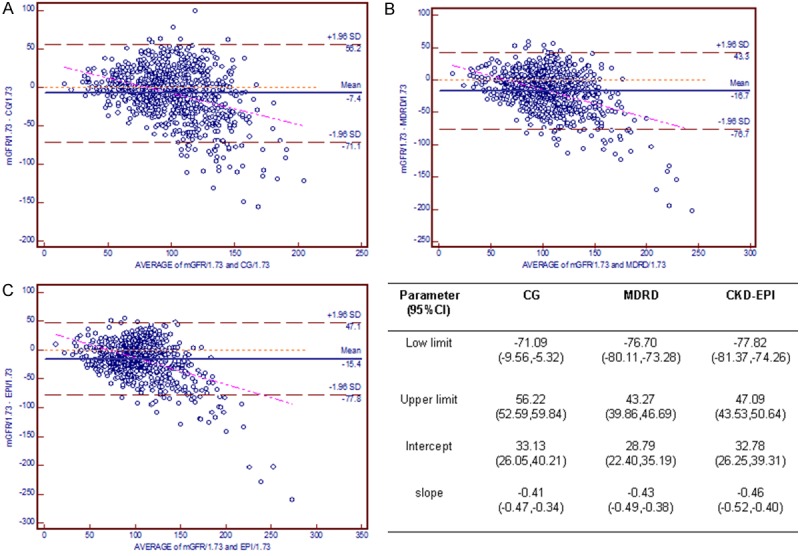
Bland-Altman plot depicting the disagreement between estimated GFR and mGFR in the HbA1c ≥ 10.5% cohort. The red line indicates the regression line of differences versus averages; A. CG equation; B. MDRD equation; C. CKD-EPI equation. Abbreviations: CG, the Cockcroft-Gault equation; MDRD, the Modification of Diet in Renal Disease simplified equation; CKD-EPI, the Chronic Kidney Disease Epidemiology Collaboration (CKD-EPI) equation.