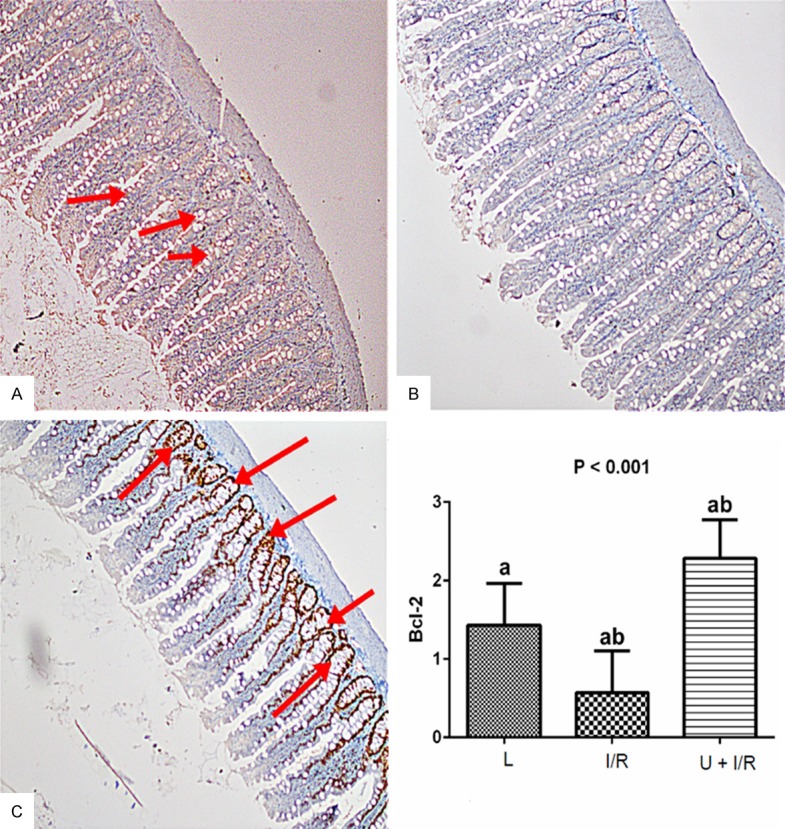
Figure 5.

Examination of Bcl-2 expression in intestinal tissues in the assay groups. A. Bcl-2 staining (Bcl-2 x 100) showed that there was no change in L rats. B. Significant decrease in the number of Bcl-2 positive cells were observed in I/R group. C. The Ukrain significantly increased the Bcl-2 positive cells. Bcl-2 expression was examined using immunohistochemical staining. Stained cells were scored as semiquantitative: no staining (score: 0), mild staining (score: 1), moderate staining (score: 2), and severe staining (score: 3). Results are expressed as the mean ± standard error of mean (SEM); n = 8. P: Shows the differences between all groups (Kruskal-Wallis test). a,b: In each line, the differences between the means with same letters are significant, P≤0.05 (Mann-Whitney U test).
