
Figure 3.
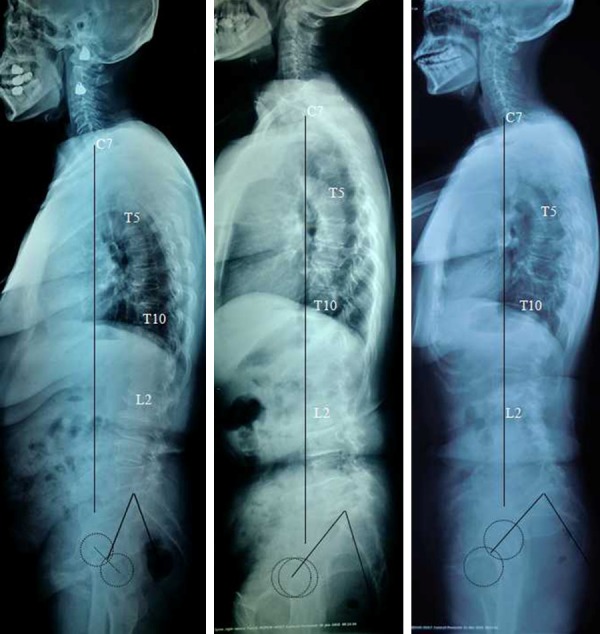
Whole spine Lateral radiographs of DLS in terms of low PI (Left), middle PI (Middle), and high PI (Right). Note the hypo-lordotic lumbar curve in low PI and relatively preserved lumbar lordosis in high PI.
Official websites use .gov
A
.gov website belongs to an official
government organization in the United States.
Secure .gov websites use HTTPS
A lock (
) or https:// means you've safely
connected to the .gov website. Share sensitive
information only on official, secure websites.
Whole spine Lateral radiographs of DLS in terms of low PI (Left), middle PI (Middle), and high PI (Right). Note the hypo-lordotic lumbar curve in low PI and relatively preserved lumbar lordosis in high PI.